Posts

Showing posts from February, 2023

The Shooting Star Candlestick Pattern
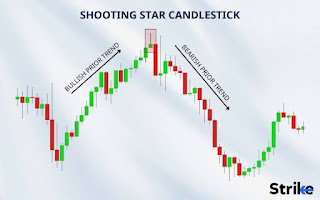
Image
 ### The Shooting Star Candlestick Pattern #### Description The Shooting Star is a bearish reversal candlestick pattern that typically appears at the top of an uptrend. It is characterized by a small real body near the lower end of the trading range, a long upper wick (shadow), and little or no lower wick. The long upper wick indicates that the market opened, rallied significantly, but then gave up most of the gains to close near the opening price. #### Characteristics - **Small Real Body**: Indicates minimal difference between the opening and closing prices. - **Long Upper Wick**: Reflects strong upward movement that was not sustained. - **Short or Absent Lower Wick**: Suggests limited lower price movement during the period. #### Significance The Shooting Star pattern signals that buyers initially drove prices higher, but sellers regained control, pushing prices back down. This shift in momentum from bullish to bearish suggests a potential reversal from an uptrend to a downtrend. ...

How to trade without losses? 7 golden rules

Image
How to trade without losses? 7 golden rules Trader level (Beginner) Type of strategy (Universal) Timeframe (1-300 m) Assets to trade (Any) Can you avoid losses? No way. Losses in trading are inevitable. After all, like in any other business. But you can use simple  rules  and discipline to maximise your profits! We're going to describe the rules in this article. But taking care of discipline in following them is your responsibility... Good news:  you don't have to avoid all and any losses. To make money, you just have to be in the black by the close of the day or at least the week. For example, on an asset with returns of 80%, you may make 4 losing trades out of 10. And still, your deposit will be more than before you started trading! Please note that 4 out of 10 is 40%, or fairly many losing trades, provided they are all for the same amount. So, how can you still trade profitably? Step 1: Key principles - Stick to your trading plan and strategy. This is crucial: the...

The "Night channel" trading strategy

Image
The "Night channel" trading strategy Trader level (Beginner) Type of strategy (Flat) Timeframe (60-300 m) Assets to trade (Currency pairs) When is the best time to trade—day or night? Have you learned how to identify trends, and manage your capital well, and do you have the skills to instantly react to changing market conditions? Then day trading is precisely what you need. But if you prefer to trade stress-free on a calm market, you should consider the potential of night trading. You might be able to earn even more and do it more easily at night! What do we get from night trading? At night, asset markets are in a sideways trend with little amplitude. So, with the right approach, we get the following: • an almost 100% predictable market; • slow movement of quotes, which will allow you to make trading decisions without haste or stress; Thus, our night-time trading becomes much less risky, and often more profitable. How can we trade profitably at night? Now let's look at th...

Technical indicators

Image
  Technical indicators Trader level (Beginner) Type of strategy (Trend) Timeframe (60-300 m) Assets to trade (Any) Technical Indicators  are tools for analyzing the dynamics of asset price movement, building indicator trading systems, and receiving trading signals for making trades. Moving Average, МА Moving Average, МА  — the average asset price over a certain period. The user sets that period in the settings. When using the Moving Average indicator on the quote chart (candlestick chart), the trader can more accurately and clearly determine the general direction of asset price movement. This helps the trader make the right decision when making their forecast about the direction of the trade at that moment and for the near future. The price chart also shows movement UP, but less clearly The indicator's general direction shows movement UP Moving Average indicator settings: The longer the indicator's period is, the more candles are used to calculate the average price. ...

Trading on the news: turning information into profit

Image
  Trading on the news: turning information into profit Trader level (Beginner) Type of strategy (Universal) Timeframe (60-300 m) Assets to trade (Currency pairs, Indices, Cryptocurrency) The strategy for trading on the news is quite interesting. The economic calendar publishes events that might affect an asset and based on the results of those events, a trade is concluded. However, there are a few subtleties that are worth paying attention to. Knowing the time the statistics will be released, the trader can draw up a trading plan for UP/DOWN trades with assets that will be affected by this information. For the trading on the news strategy, it is worth using information leads, data that quite often does not meet expectations. For example, data on the United States periodically show discrepancies with the opinions of analysts, which makes the price move UP or DOWN. It is the discrepancy in data that is the driver of price growth/decline. The trader makes their trade after the re...

How to money management - 50% of your success!

 Money management - 50% of your success! Trader level (Beginner) Type of strategy (Universal) Timeframe (1-300 m) Assets to trade (Any) Money Management  is a set of rules and techniques designed to minimize risks and maximize profits. A proper business strategy is only 50% of success, the other half depends on the money management the trader uses. Utilize the following guidelines in your trading, and you'll achieve the best possible results in trading. Risk not exceeding 3% Maintaining clear control of the level of risk in each transaction is the first and most fundamental rule of money management. Regardless of how proven or profitable the trading system is, if there are changes in the nature of price movement, oversized transactions can lead to large losses. And if the cost of a transaction doesn't exceed 3% of the size of the trading account, you can easily overcome a losing period and quickly make up for your losses in the future. Limiting potential losses for the da...

How to “Pathfinder”: version to trade in flat

Image
 “Pathfinder”: version to trade in flat Trader level (Experienced) Type of strategy (Flat) Timeframe (15-30 m) Assets to trade (Any) More often than not, the market is flat in the evening and at night (UTC): the price moves calmly within a rather narrow price range. Fluctuations are small but quite predictable, so you can trade on them. The main question is how do we determine moments of price reversal during a flat? We'll tell you and show you now! Step 1: Preparing the indicators Select the  Bollinger Bands indicator  with default settings. It will show the moments of maximum deviation of the price from its average value. Then select  RSI  (Relative Strength Index) and apply the following settings: • Period 9 • Overbought level 70 • Oversold Level 30 The RSI will show the moments of price reversal. Add the  Moving Average  indicator. Configure as follows: • Period 2 • type Simple • Red color It will show the current (short-term) trend. It is rec...

Market convergence/divergence with the RSI: let's determine the beginning of correction and earn

Image
Market convergence/divergence with the RSI: let's determine the beginning of correction and earn Trader level (Experienced) Type of strategy (Trend) Timeframe (60-300 m) Assets to trade (Any) The RSI (Relative Strength Index) shows the strength of the trend and the likelihood of it reversing. You can use the RSI in any market conditions: an uptrend, downtrend, or flat. And you can also find one of the strongest signals of correction or trend change on the RSI: market convergence/divergence. How do you do that? Step 1: Configure the indicator In the "Indicators" tab, select RSI and configure the following settings: • Overbought 70 • Oversold 30 • Period 8 Step 2: Use the indicator to make a profit: How to conclude trades UP We wait until the RSI drops below level 30 and forms 2 minimums there. And the 2nd should be above the first: In the "Tools" tab, select "Beam" and draw the beam from left to right directly through the minimums on the RSI indicator. ...

How to trading on Fibonacci levels

Image
Trading on Fibonacci levels Trader level (Experienced) Type of strategy (Trend) Timeframe (60-300 m) Assets to trade (Any) The most effective trading tactic is trading on the main price movement — on the trend. And the best moment to conclude a trade is the moment the price reverses along the trend after a lull, i.e., a flat. Or even short movement against the trend — price correction. To determine when the price will reverse and follow the trend again, use the "Fibonacci Correction" tool, a unique technical analysis tool. Step 1: Determining a trend with correction beginning We observe the asset price movement, and wait until trend correction begins. It usually looks something like this: Step 2: Building Fibonacci levels Select the Fibonacci Tool, type Extension. We draw a Fibonacci grid on the quote chart: put the first point at the very beginning of the trend, the second at the very top. We now have reference levels:  38.2%; 50%, and 61.8%. The thing is that in most cases,...

Puria Method Indicative Strategy

Image
Puria Method Indicative Strategy Trader level (Experienced) Type of strategy (Trend) Timeframe (5-300 m) Assets to trade (Currency pairs, Indices, Cryptocurrency) The “Puria Method” trading system has existed for a very long time. Many exchange traders choose it for its simplicity and efficiency. If you have not heard of it or have never put it into practice, now is the time! Let's see how it works. Step 1: Indicator setup Plot MACD with these settings: • Fast period 15; • Signal period 1 • Slow period 26; Plot the 1st Moving Average with these settings: • Period 75 • Type Weighted; • Red color. Leave the remaining settings unchanged. Plot the 2nd Moving Average with these settings: • Period 85 • Type Weighted; • Purple color. Do not modify the remaining settings. The key principle of the Puria Method is follow the trend. 2 Moving Averages will help you determine the trend, and MACD (the Moving Average Convergence-Divergence) will help you spot the incipient wave of an up- or downt...

Popular posts from this blog

The "Night channel" trading strategy

How to Use the Fibonacci Indicator in Trading

Technical indicators