The Shooting Star Candlestick Pattern
Image
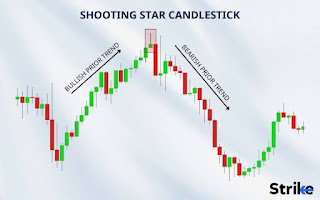
 ### The Shooting Star Candlestick Pattern #### Description The Shooting Star is a bearish reversal candlestick pattern that typically appears at the top of an uptrend. It is characterized by a small real body near the lower end of the trading range, a long upper wick (shadow), and little or no lower wick. The long upper wick indicates that the market opened, rallied significantly, but then gave up most of the gains to close near the opening price. #### Characteristics - **Small Real Body**: Indicates minimal difference between the opening and closing prices. - **Long Upper Wick**: Reflects strong upward movement that was not sustained. - **Short or Absent Lower Wick**: Suggests limited lower price movement during the period. #### Significance The Shooting Star pattern signals that buyers initially drove prices higher, but sellers regained control, pushing prices back down. This shift in momentum from bullish to bearish suggests a potential reversal from an uptrend to a downtrend. ####

Puria Method Indicative Strategy

Puria Method Indicative Strategy

Trader level (Experienced)

Type of strategy (Trend)

Timeframe (5-300 m)

Assets to trade (Currency pairs, Indices, Cryptocurrency)


The “Puria Method” trading system has existed for a very long time. Many exchange traders choose it for its simplicity and efficiency. If you have not heard of it or have never put it into practice, now is the time! Let's see how it works.

Step 1: Indicator setup

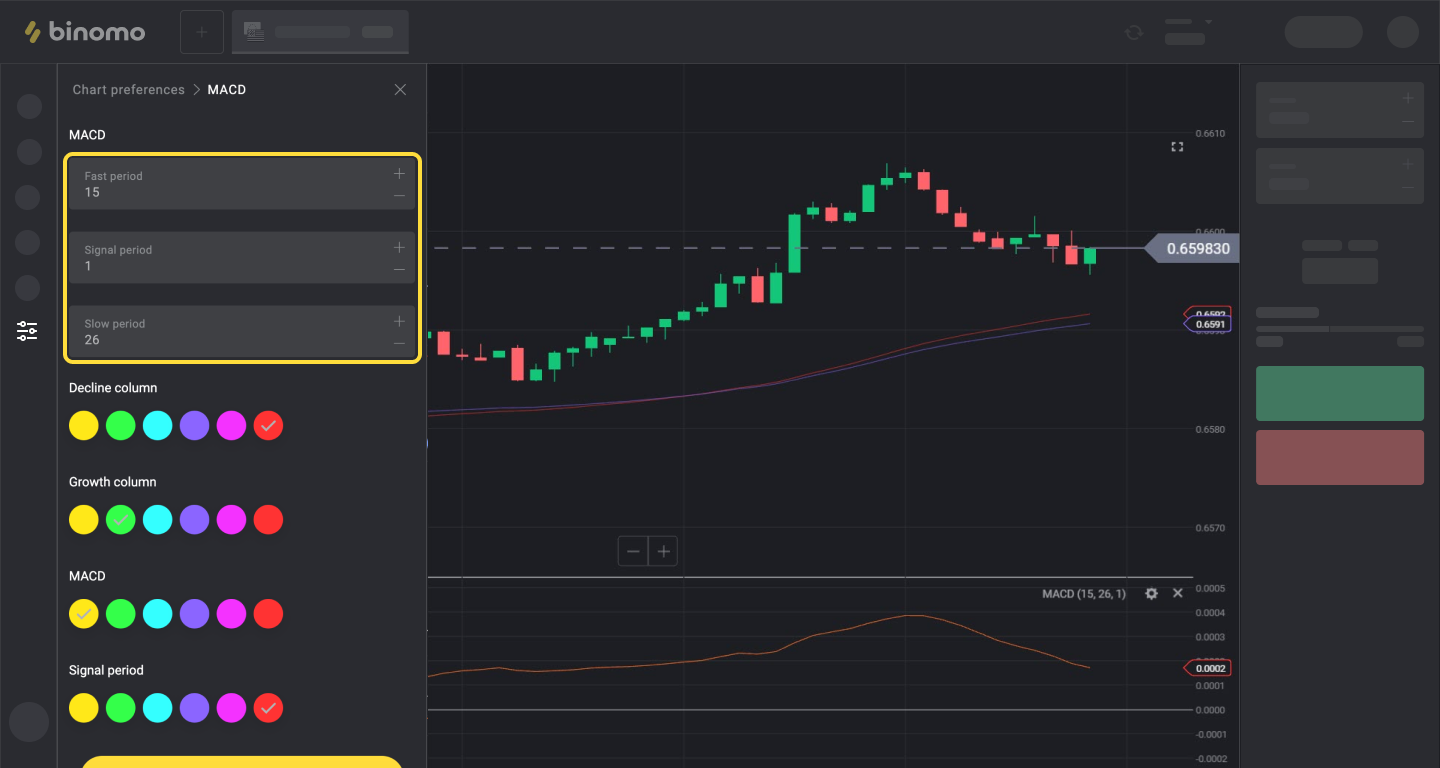
Plot MACD with these settings:
• Fast period 15;
• Signal period 1
• Slow period 26;
Puria Method Indicative Strategy_en1.png

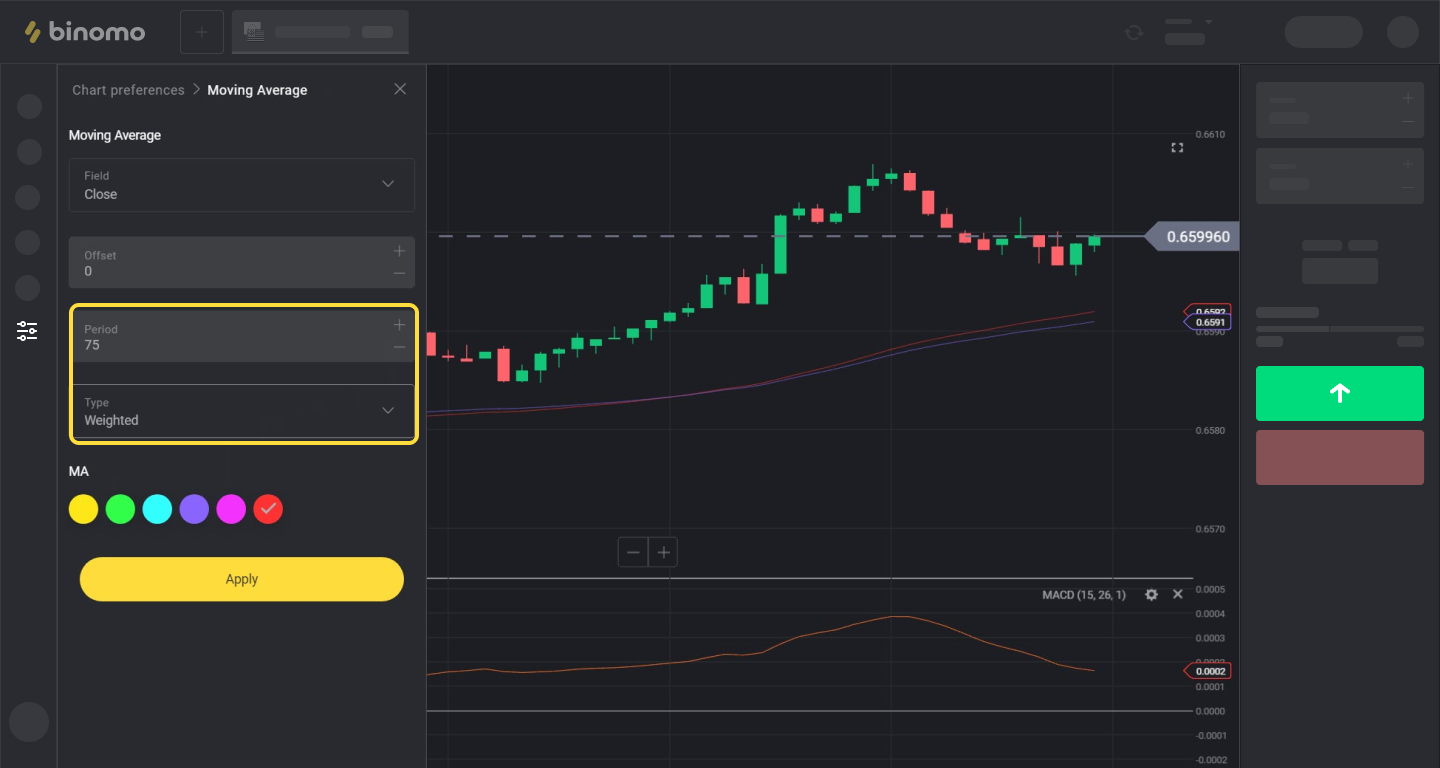
Plot the 1st Moving Average with these settings:
• Period 75
• Type Weighted;
• Red color.
Leave the remaining settings unchanged.
Puria Method Indicative Strategy_en2.png

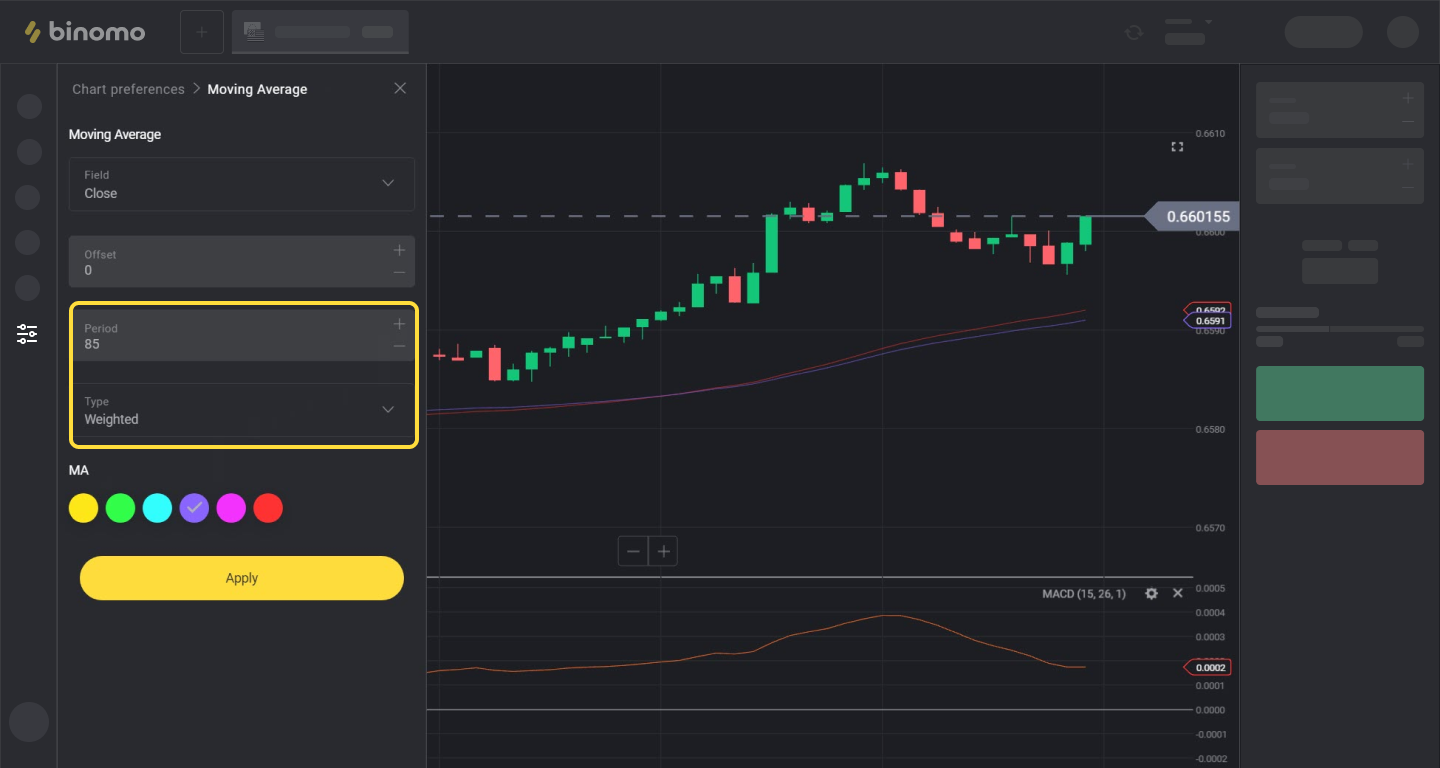
Plot the 2nd Moving Average with these settings:
• Period 85
• Type Weighted;
• Purple color.
Do not modify the remaining settings.
Puria Method Indicative Strategy_en3.png

The key principle of the Puria Method is follow the trend.
2 Moving Averages will help you determine the trend, and MACD (the Moving Average Convergence-Divergence) will help you spot the incipient wave of an up- or downtrend.

Step 2. Choose the time frame and expiration of your trades

It’s best to choose a short time frame, or you'll have to wait a long time for signals.

  • Expiration starts with 5 candles of the trading TF. I.e. it will be 1+ minute for 5s; and 10+ minutes for 1M.
  • And don't forget about risk management! Do not use more than 3% of the funds in your trading account for a trade!

Step 3: Make trades

Trade UP when the following happens:
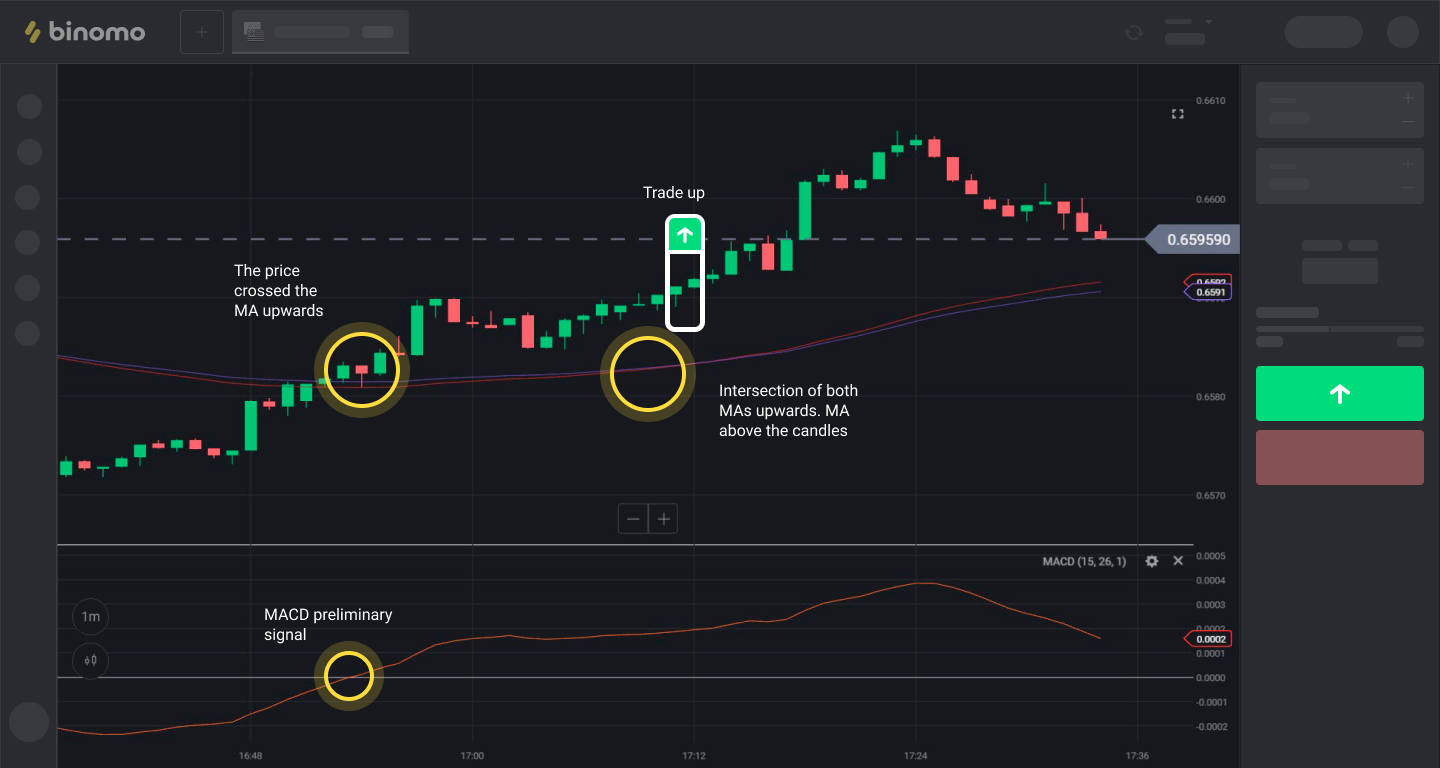
  • The MACD line crosses the zero level up. Usually this is a preliminary signal, so, instead of making a trade on it right away, wait for signals of other indicators.
  • The price crosses both Moving Averages up.
  • Moving Averages cross UP and are below the price (candlesticks)
    This is the main signal;

Puria Method Indicative Strategy_en4.png

Trade DOWN when the following happens:
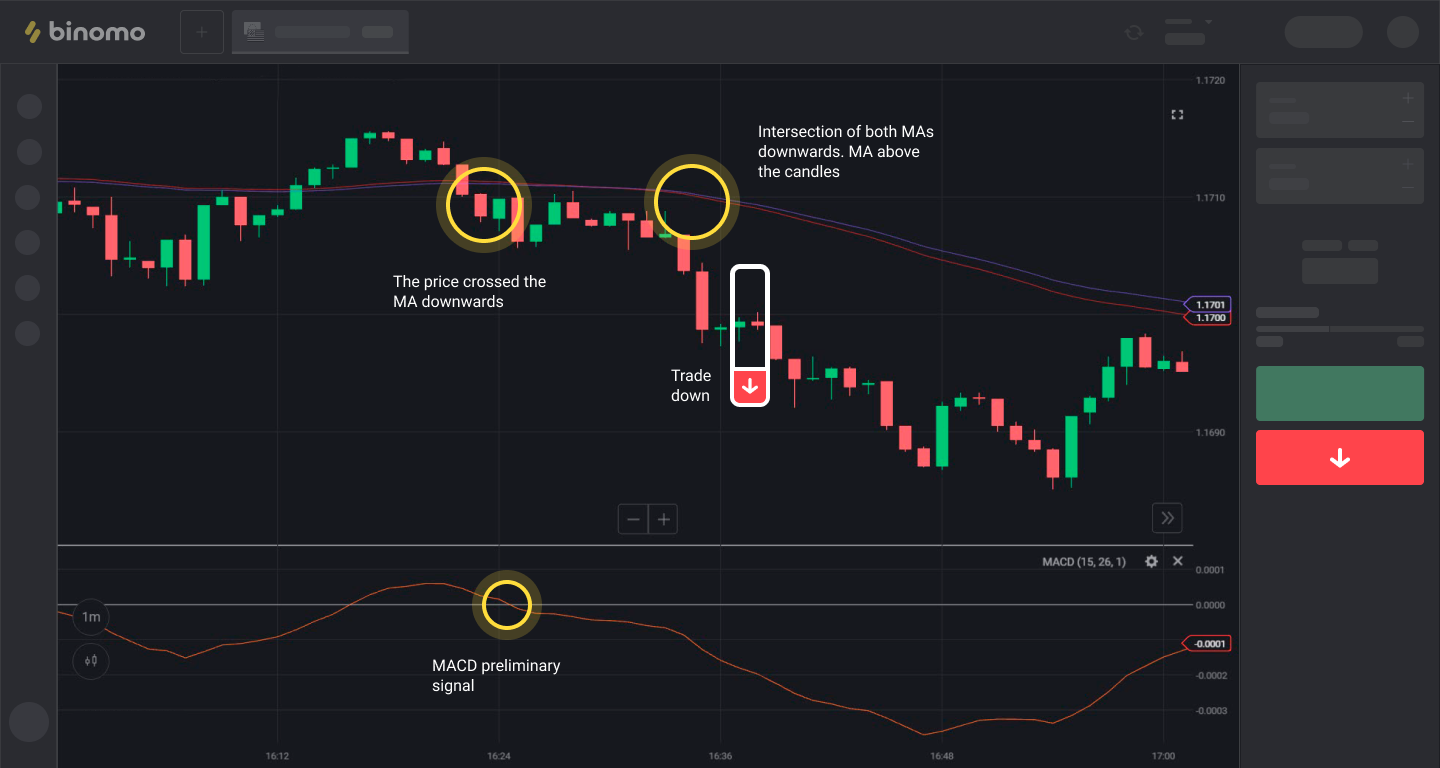
  • The MACD line crosses the zero level down. This is also a preliminary signal, so wait for confirmation by other indicators.
  • The price crosses both Moving Averages down.
  • Moving Averages cross DOWN and are above the price (candlesticks)
    This is the main signal to trade DOWN;

Puria Method Indicative Strategy_en5.png

Comments

Popular posts from this blog

The "Night channel" trading strategy

How to Use the Fibonacci Indicator in Trading

Technical indicators