The Shooting Star Candlestick Pattern
### The Shooting Star Candlestick Pattern
#### Description
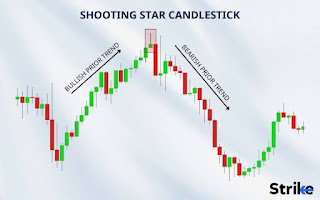
The Shooting Star is a bearish reversal candlestick pattern that typically appears at the top of an uptrend. It is characterized by a small real body near the lower end of the trading range, a long upper wick (shadow), and little or no lower wick. The long upper wick indicates that the market opened, rallied significantly, but then gave up most of the gains to close near the opening price.
#### Characteristics
- **Small Real Body**: Indicates minimal difference between the opening and closing prices.
- **Long Upper Wick**: Reflects strong upward movement that was not sustained.
- **Short or Absent Lower Wick**: Suggests limited lower price movement during the period.
#### Significance
The Shooting Star pattern signals that buyers initially drove prices higher, but sellers regained control, pushing prices back down. This shift in momentum from bullish to bearish suggests a potential reversal from an uptrend to a downtrend.
#### Criteria for a Valid Shooting Star
1. **Uptrend Preceding the Pattern**: The pattern should appear after a noticeable uptrend.
2. **Small Real Body**: Located near the lower end of the price range.
3. **Long Upper Wick**: At least twice the length of the real body.
4. **Little to No Lower Wick**: The lower wick should be very short or absent.
#### Interpretation and Trading Strategy
1. **Confirmation**: Traders often wait for confirmation of the reversal, which may come in the form of a bearish candle following the Shooting Star.
2. **Entry Point**: After confirmation, traders may enter a short position.
3. **Stop Loss**: A stop-loss order can be placed above the high of the Shooting Star to manage risk.
4. **Target**: The target can be set based on support levels, previous lows, or a risk-reward ratio.
#### Example Scenario
Imagine a stock in a steady uptrend. One day, the stock opens at $50, surges to $60 during the trading session, but closes near the opening price at $52. This forms a Shooting Star with a long upper wick, indicating that despite the initial bullish momentum, sellers took control. If the following day the stock opens lower and forms a bearish candle, this confirms the potential reversal, signaling a possible shorting opportunity.
### Conclusion
The Shooting Star is a powerful candlestick pattern that can signal a potential reversal at the top of an uptrend. However, like all technical analysis tools, it should be used in conjunction with other indicators and analysis methods to increase the probability of successful trades. Proper risk management is also essential to mitigate potential losses.
Understanding and recognizing the Shooting Star pattern can enhance your trading strategy and help you make more informed decisions in the market.
.jpeg)
Comments
Post a Comment