The Shooting Star Candlestick Pattern
.jpeg)
.jpeg)
Technical indicators
Trader level (Beginner)
Type of strategy (Trend)
Timeframe (60-300 m)
Assets to trade (Any)
Technical Indicators are tools for analyzing the dynamics of asset price movement, building indicator trading systems, and receiving trading signals for making trades.
Moving Average, МА
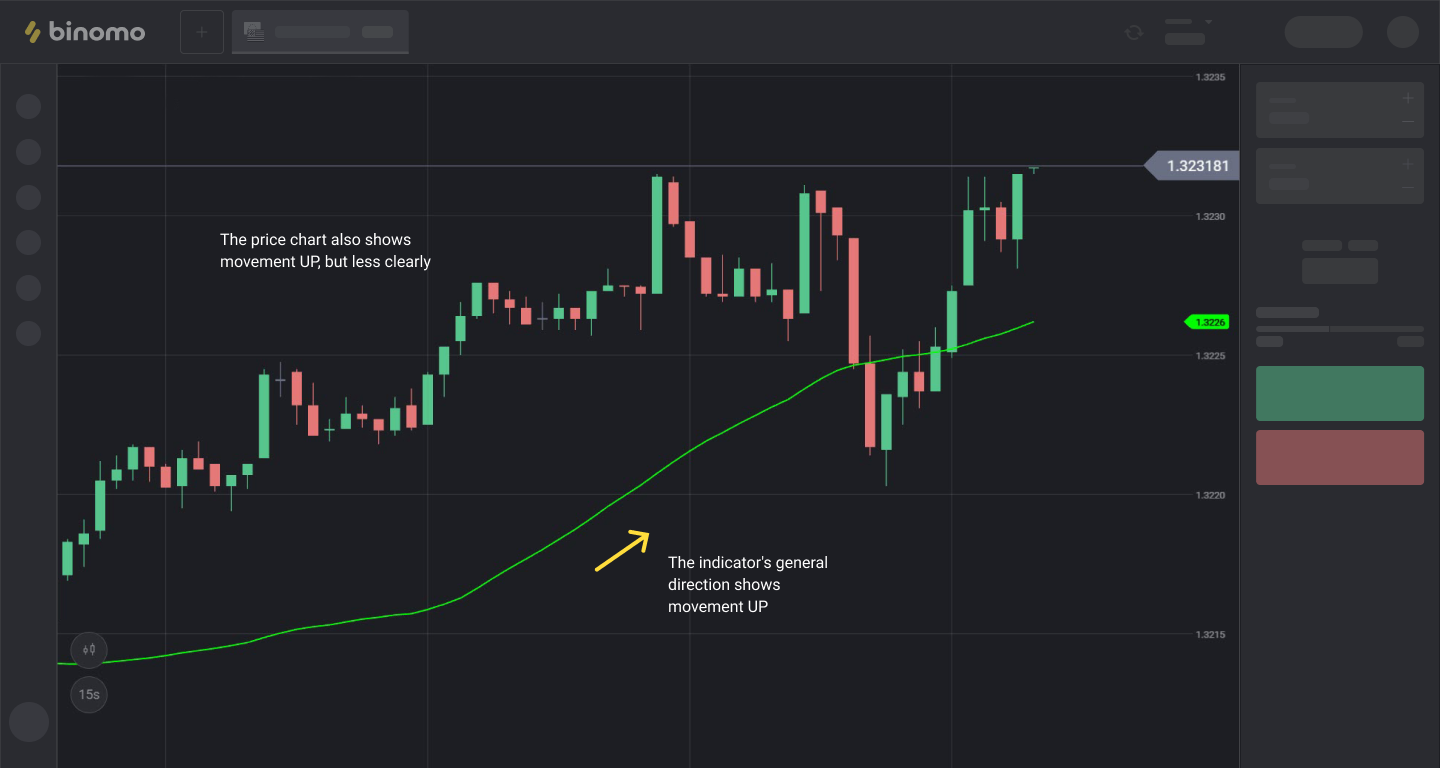
Moving Average, МА — the average asset price over a certain period. The user sets that period in the settings.
When using the Moving Average indicator on the quote chart (candlestick chart), the trader can more accurately and clearly determine the general direction of asset price movement.
This helps the trader make the right decision when making their forecast about the direction of the trade at that moment and for the near future.
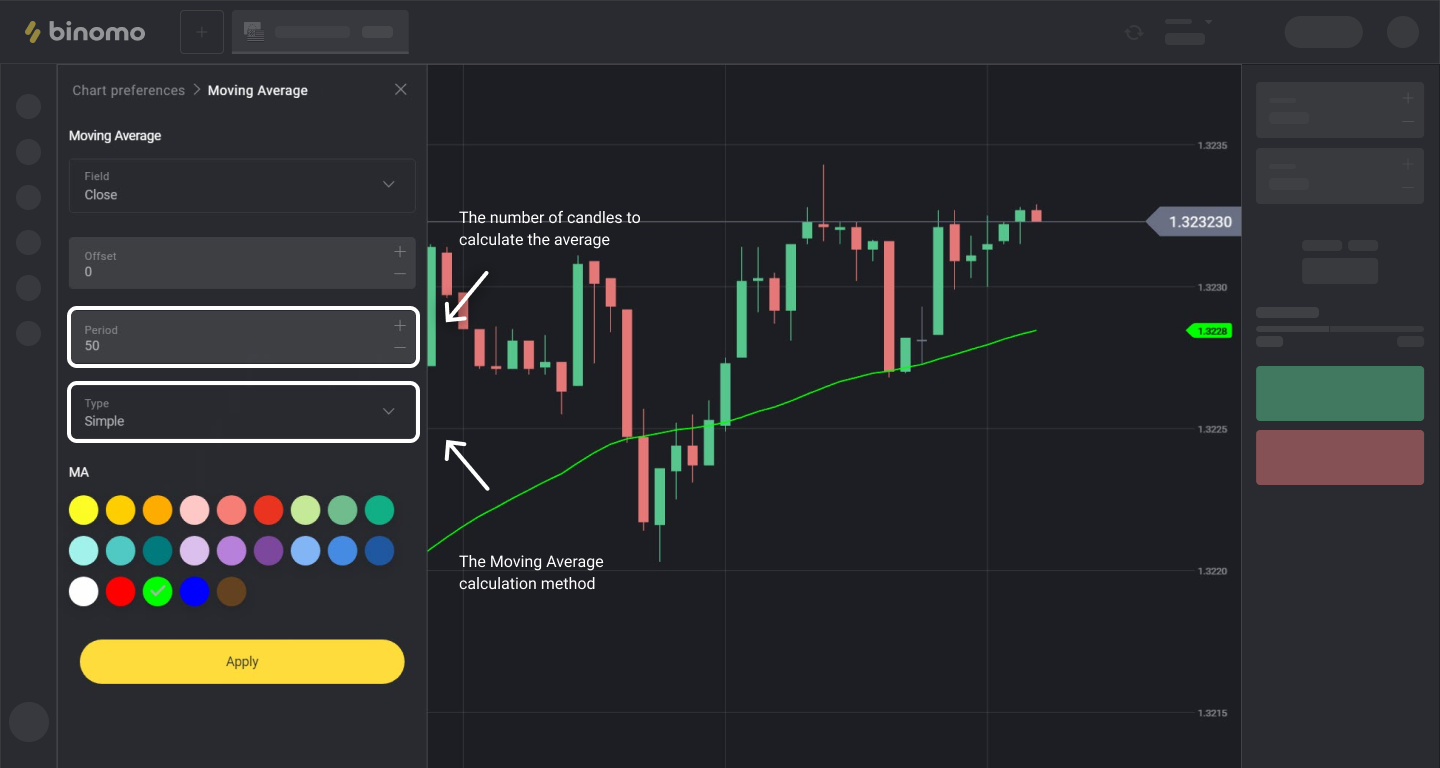
Moving Average indicator settings:
The longer the indicator's period is, the more candles are used to calculate the average price.
And, accordingly, more general data is obtained regarding the movement trend.
You can also choose the type of Moving Average indicator.
The Alligator indicator
The Alligator indicator — a technical indicator developed by the world-famous trader Bill Williams.
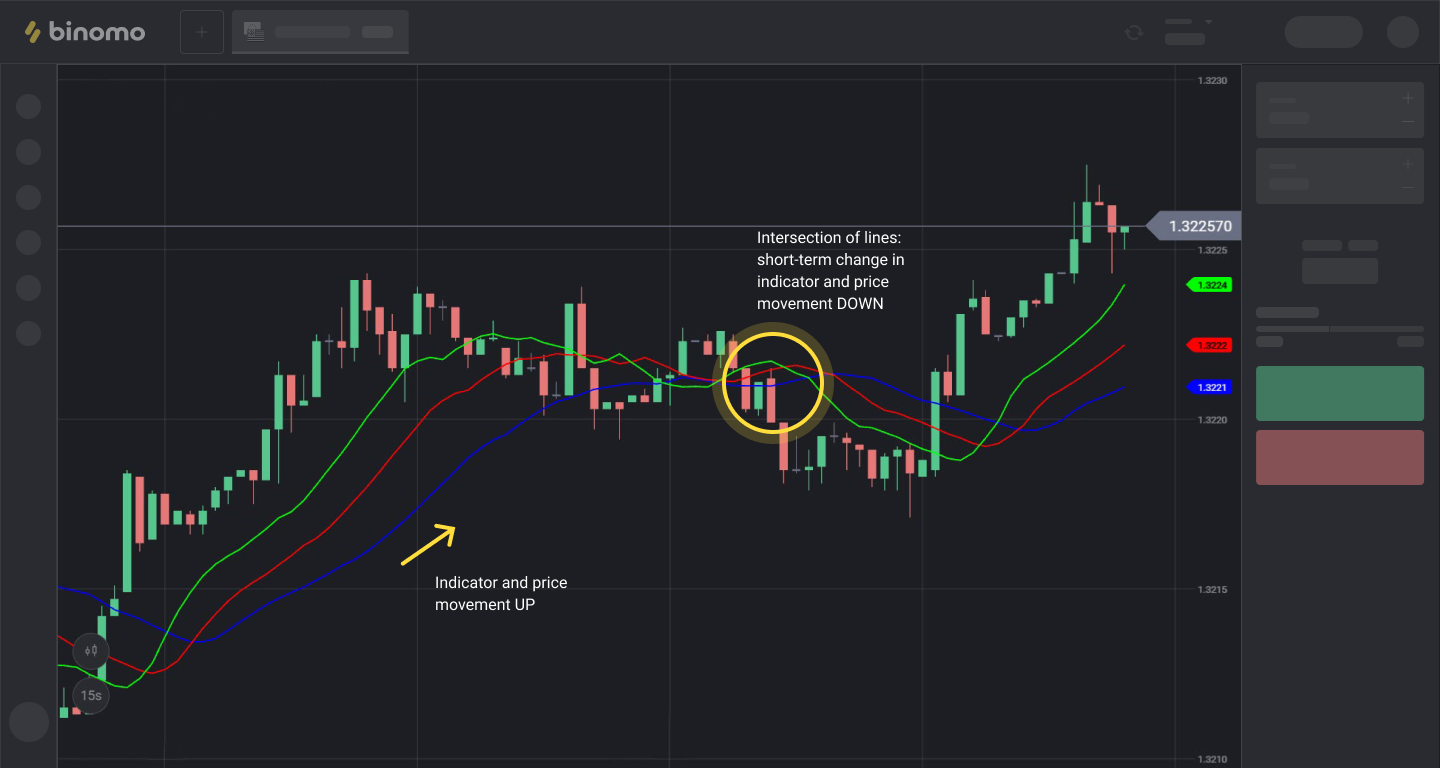
It consists of three moving averages that show changes in the quote movement dynamics more clearly and precisely than one does.
When applying the Alligator to the chart, the trader can analyze and predict not only the general direction of asset quote movement but also short-term changes in its movement.
This is helped by the intersections of the moving averages used in the indicator:
Alligator indicator settings:
Just like for the Moving Average, in the settings of the Alligator indicator, you can specify the number of candles that will be used to calculate the average price (i.e. period) for each of the three lines of the indicator. You can also change the shift for each moving average, if necessary.
In the Alligator indicator (due to its exotic name), each line has its own name: "Jaws," "Lips," and "Teeth."
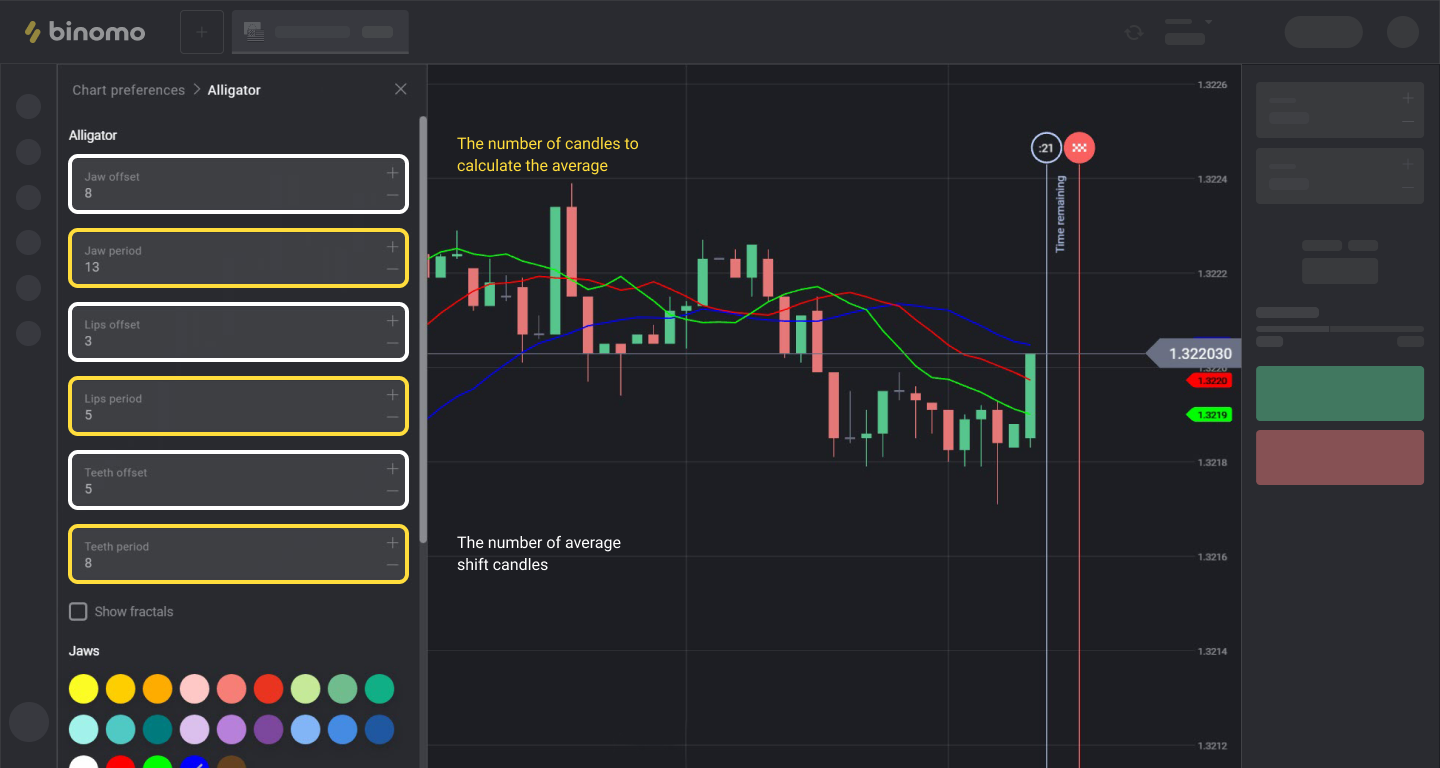
IMPORTANT! To master basic trading using the Alligator indicator, it is recommended that you use the "Default" settings.
The Bollinger Bands
The Bollinger Bands — they are a technical indicator based on the Moving Average that, in addition to calculating the average price for a certain period, also calculates its average deviation from the norm (from the average) for that period
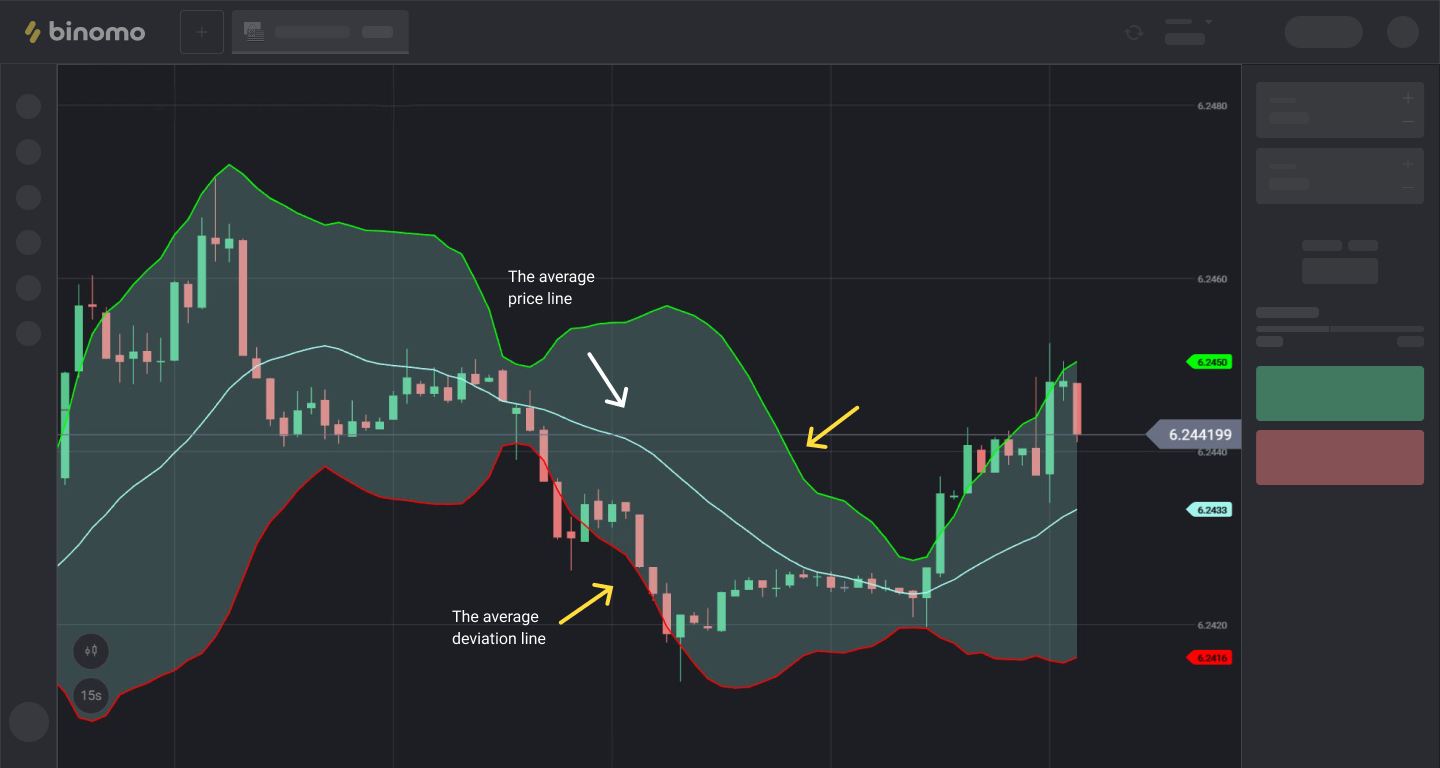
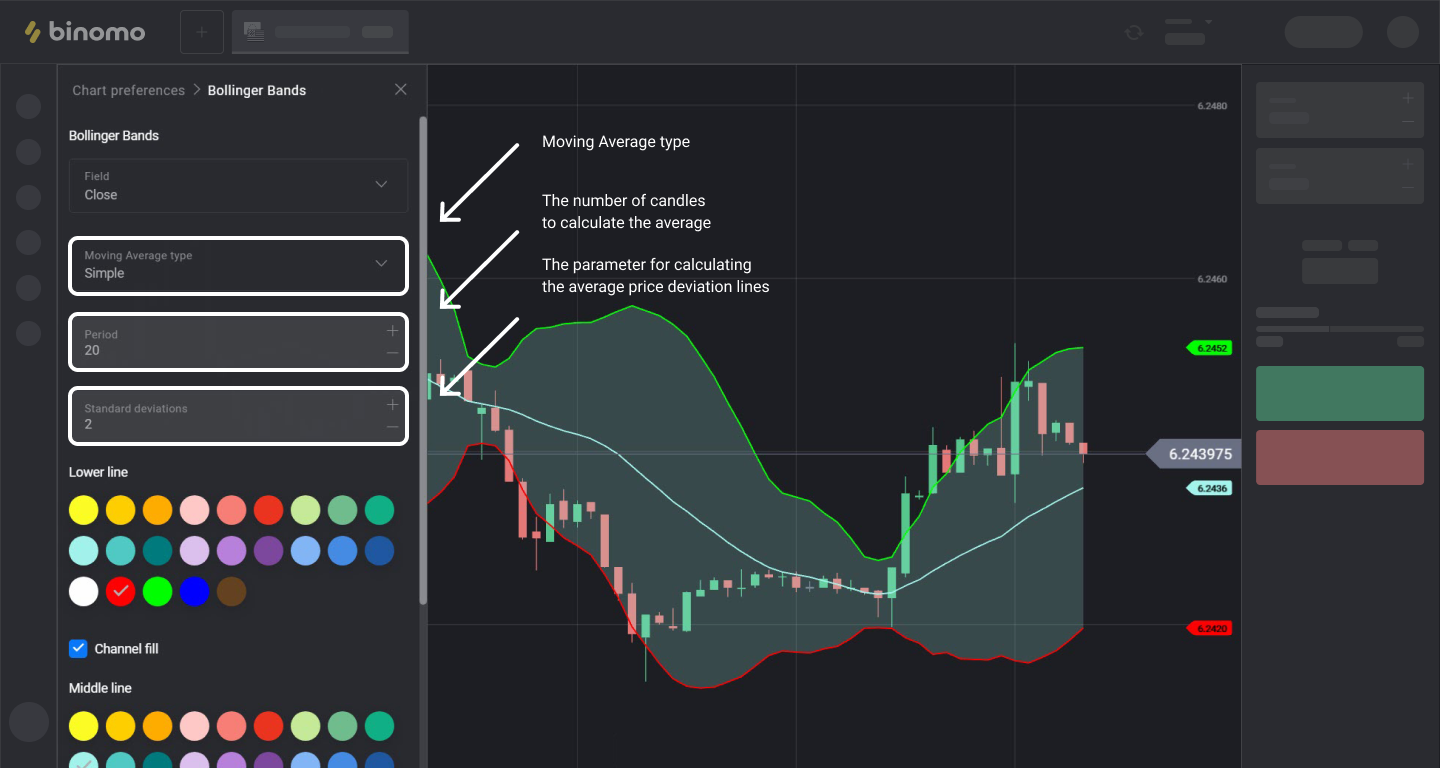
Bollinger Bands indicator settings
When setting up the Bollinger Bands indicator, the trader can set the type of moving average calculation, its period (the number of candles that are used to calculate the average price), and the parameter for calculating quote deviation from the average:
The indicator helps the trader determine the intensity of quote movement: the closer all three indicator lines are to each other, the less mobile the market is (narrow, “flat”), and the fewer opportunities there will be on such a market for making successful trades. And vice versa.
It also clearly demonstrates changes in the direction of quote movement: the price crosses the middle line of the indicator downwards and a downward trend has appeared. And vice versa.
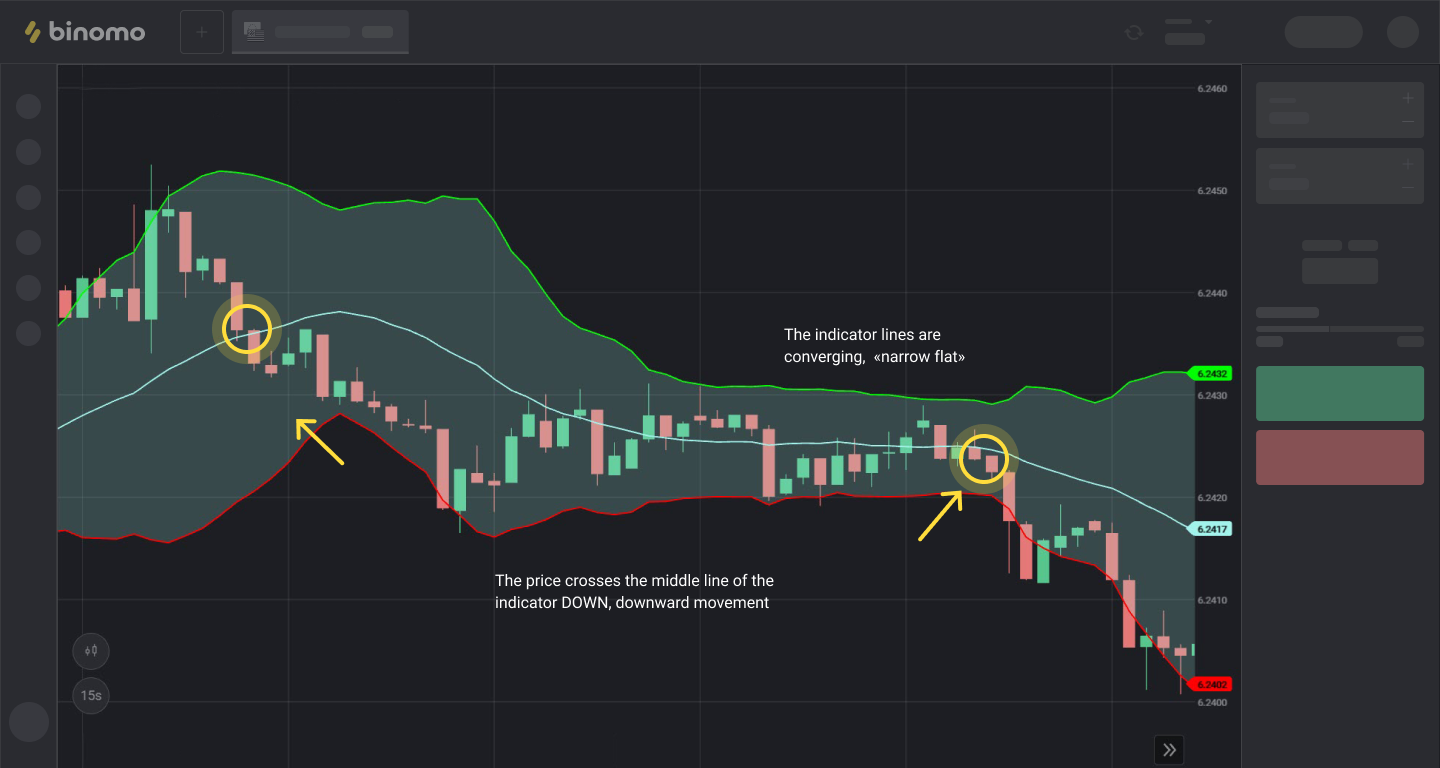
On a quiet market, the Bollinger Bands perfectly demonstrate the boundaries of the price movement range, which means the Bollinger Bands can be used for night trading in the channel.
Comments
Post a Comment