The Shooting Star Candlestick Pattern
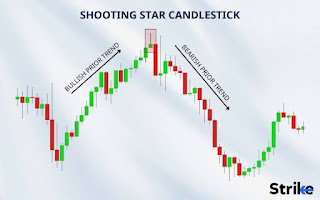.jpeg)
.jpeg)
“Pathfinder”: version to trade in flat
Trader level (Experienced)
Type of strategy (Flat)
Timeframe (15-30 m)
Assets to trade (Any)
More often than not, the market is flat in the evening and at night (UTC): the price moves calmly within a rather narrow price range. Fluctuations are small but quite predictable, so you can trade on them. The main question is how do we determine moments of price reversal during a flat?
We'll tell you and show you now!
Step 1: Preparing the indicators
Select the Bollinger Bands indicator with default settings.
It will show the moments of maximum deviation of the price from its average value.
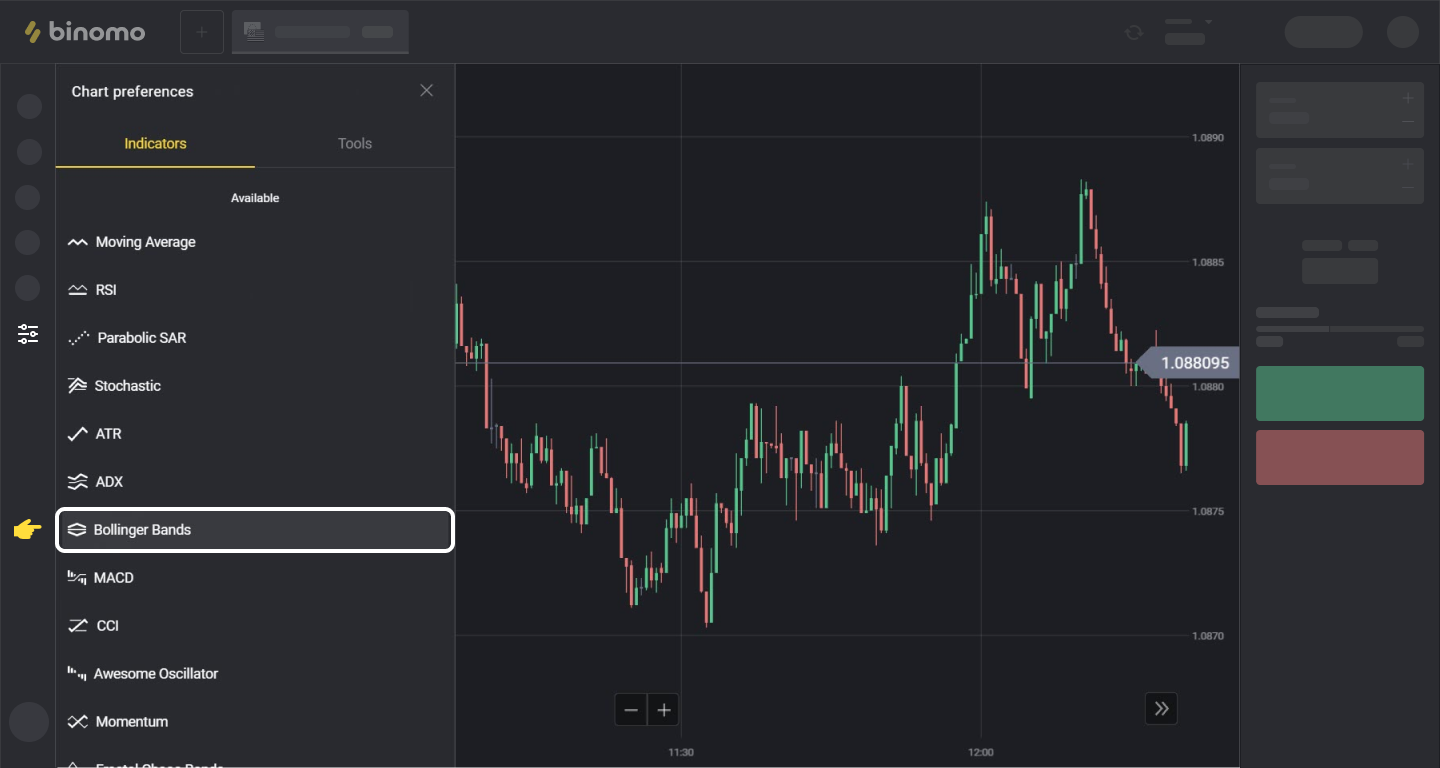
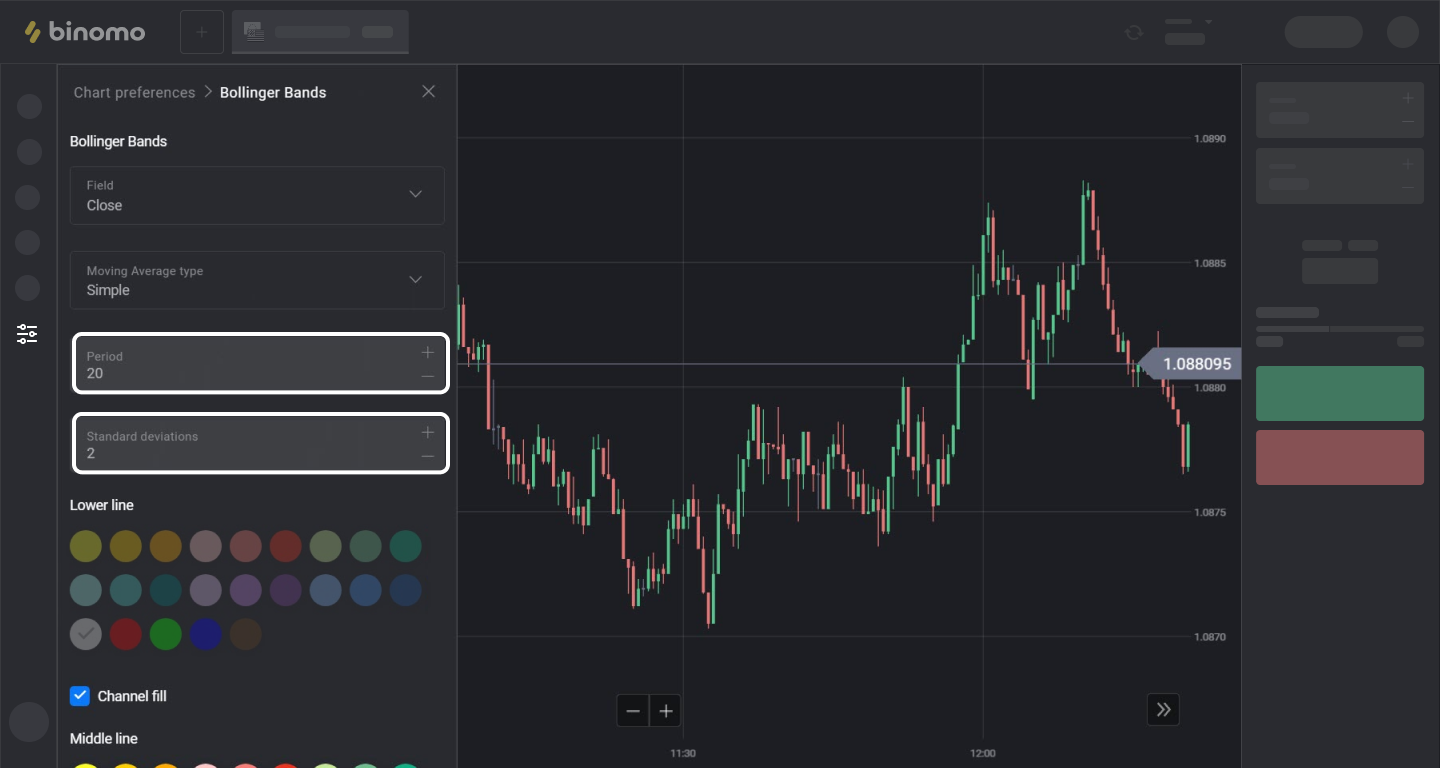
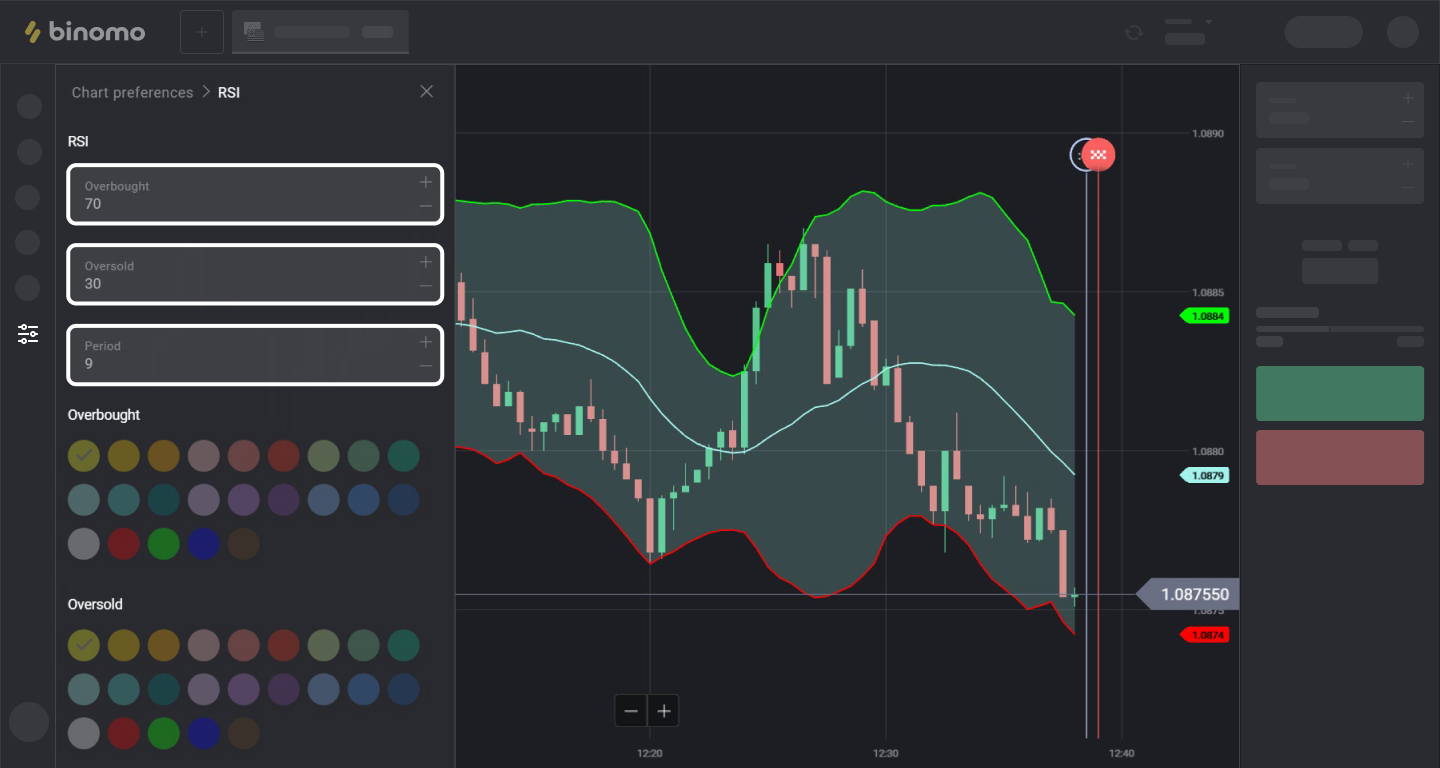
Then select RSI (Relative Strength Index) and apply the following settings:
• Period 9
• Overbought level 70
• Oversold Level 30
The RSI will show the moments of price reversal.
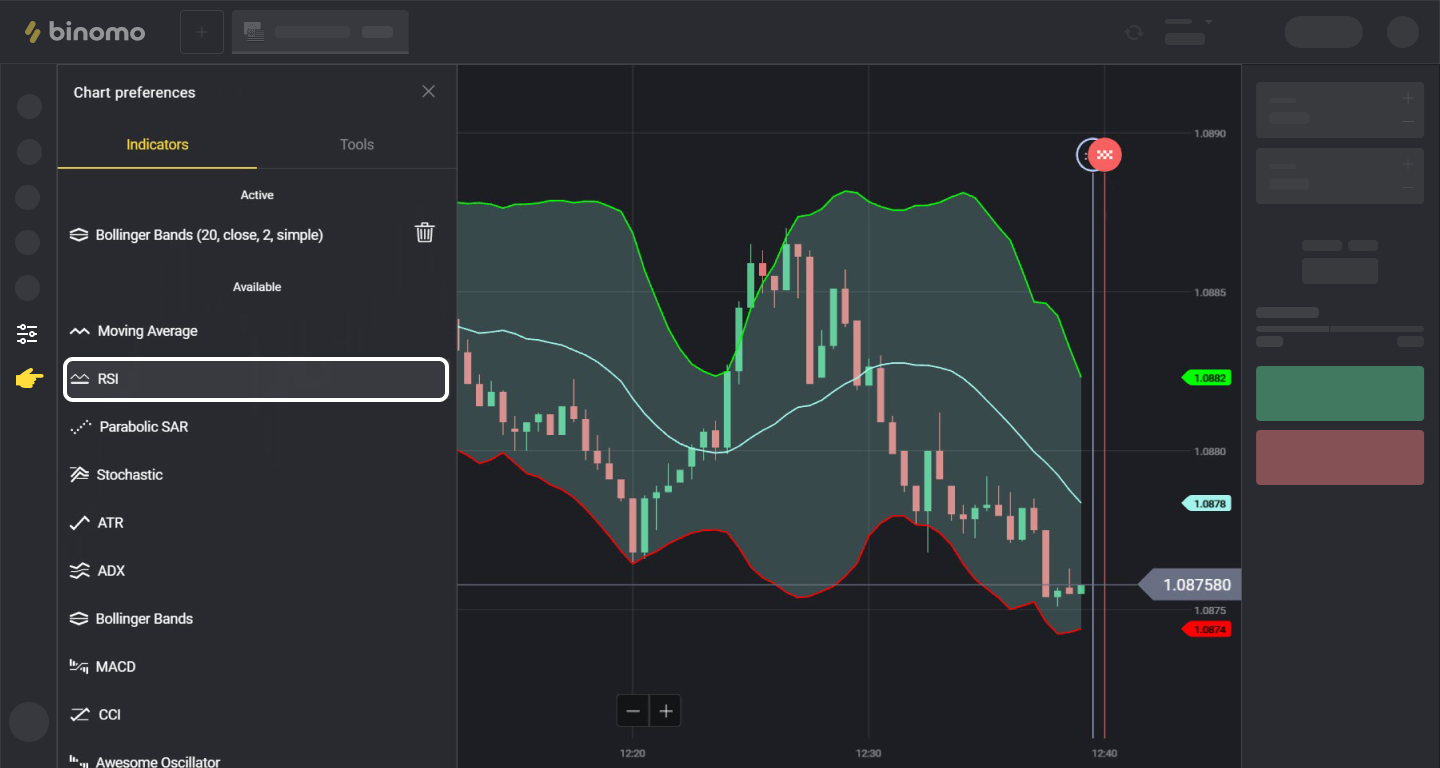
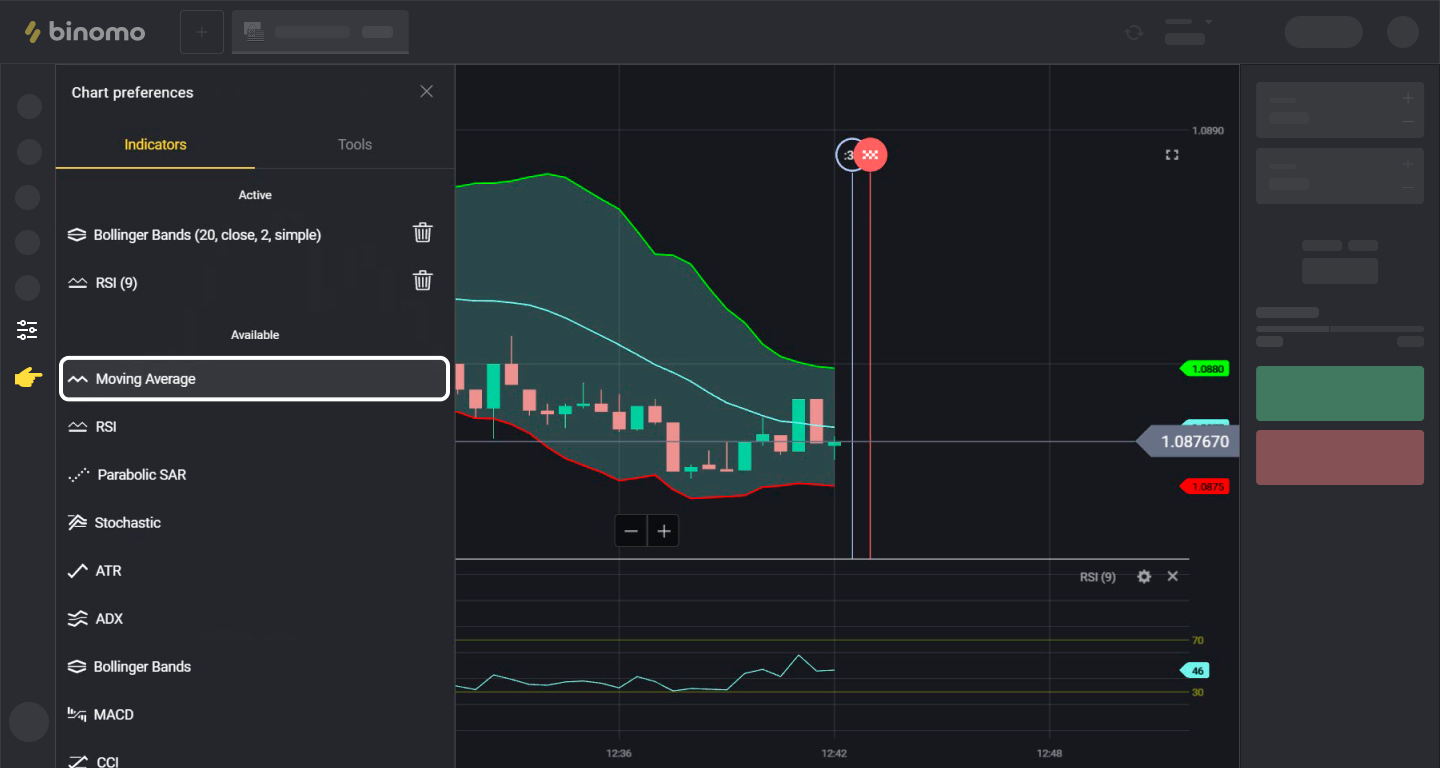
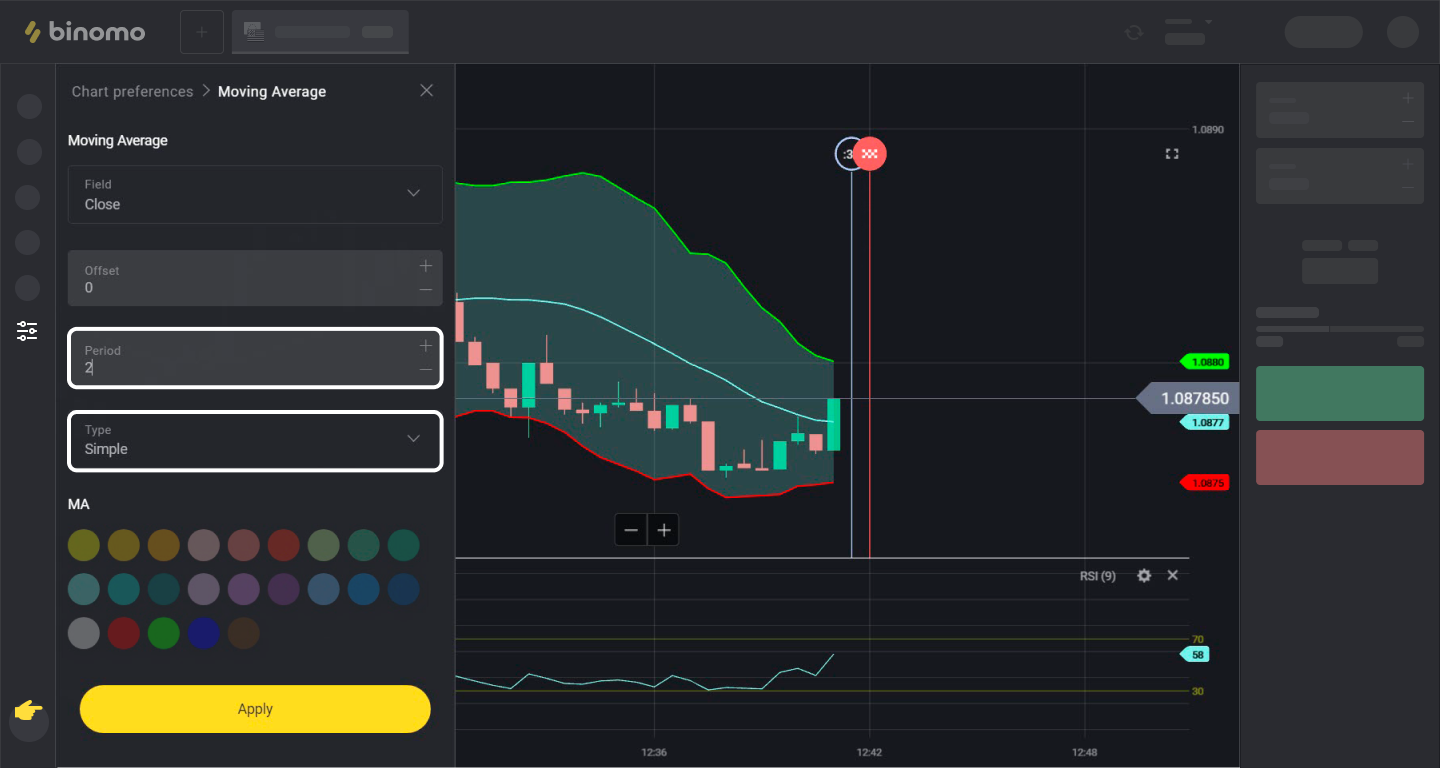
Add the Moving Average indicator. Configure as follows:
• Period 2
• type Simple
• Red color
It will show the current (short-term) trend. It is recommended to conclude trades according to the movement.
Step 2: Use the indicators to make a profit:
After you have set up all the indicators, wait until they give the signal to conclude a trade.
We'll explain in pictures.
Trade UP when:
• The line on the RSI is below level 30
• The moving average crosses the lower Bollinger line downwards and then reverses upwards.
• After that, the price (candle) closes ABOVE the LOWER line of the Bollinger
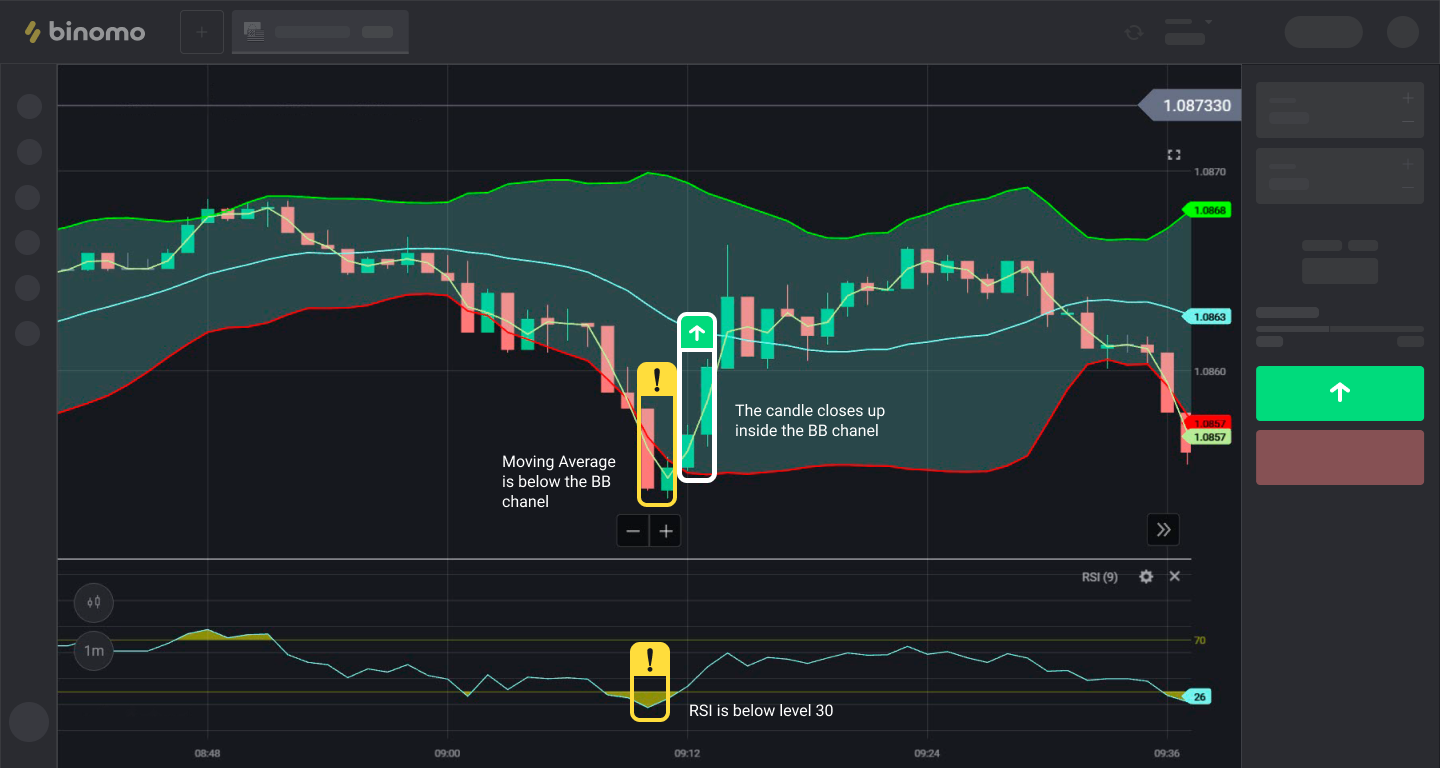
The moving Average is below the BB channel
The candle closes up inside the BB channel
RSI is below level 30
Trade DOWN when:
• The line on the RSI is above level 70
• The moving average crosses the upper Bollinger line upwards and reverses downwards.
• After that, the price (candle) closes BELOW the UPPER Bollinger line
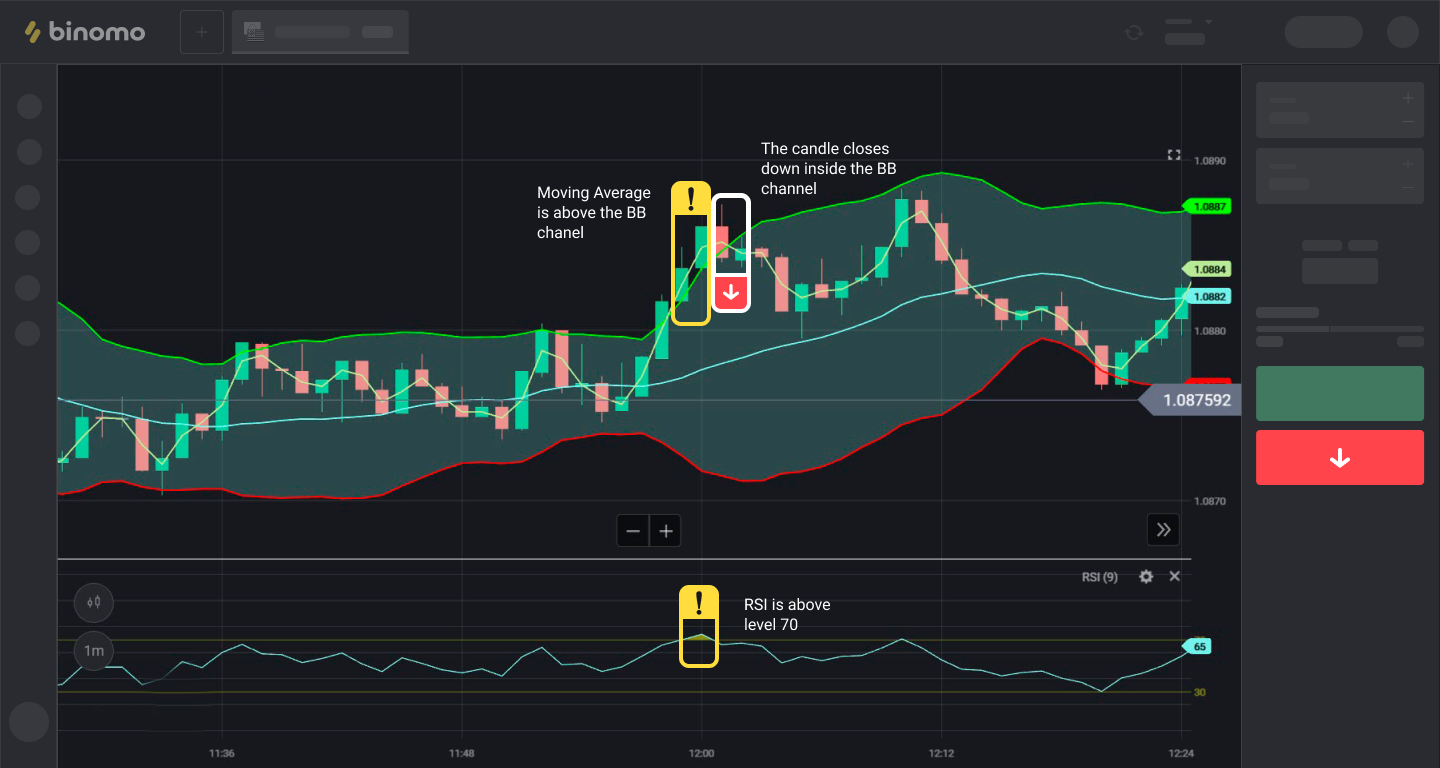
The moving Average is above the BB channel
The candle closes down inside the BB channel
RSI is above level 70
IMPORTANT!
Trading time: it is most effective during the evening and at night (UTC) starting from the second half of the American trading session (at 5:00 PM) until the end of the Asian session (until 6:00 AM).
Assets to trade: some assets are often in a flat for most of the day, except during the publication of important economic news.
For example CAD/CHF, AUD/CAD, EUR/GBP, and Gold.
The expiration (the time before the trade closes) depends on what time frame you are trading on and the intensity of the price movement after the flat.
If you chose the 15S-1M time frame, an expiration of 3-5 minutes is best.
If you prefer more extended time frames, then INCREASE the expiration as well.
It is not recommended to enter into trades that exceed 2% of your trading account (for one trade).
Comments
Post a Comment