Market convergence/divergence with the RSI: let's determine the beginning of correction and earn
Trader level (Experienced)
The RSI (Relative Strength Index) shows the strength of the trend and the likelihood of it reversing. You can use the RSI in any market conditions: an uptrend, downtrend, or flat.
And you can also find one of the strongest signals of correction or trend change on the RSI: market convergence/divergence. How do you do that?
Step 1: Configure the indicator
In the "Indicators" tab, select RSI and configure the following settings:
• Overbought 70
• Oversold 30
• Period 8
Step 2: Use the indicator to make a profit:
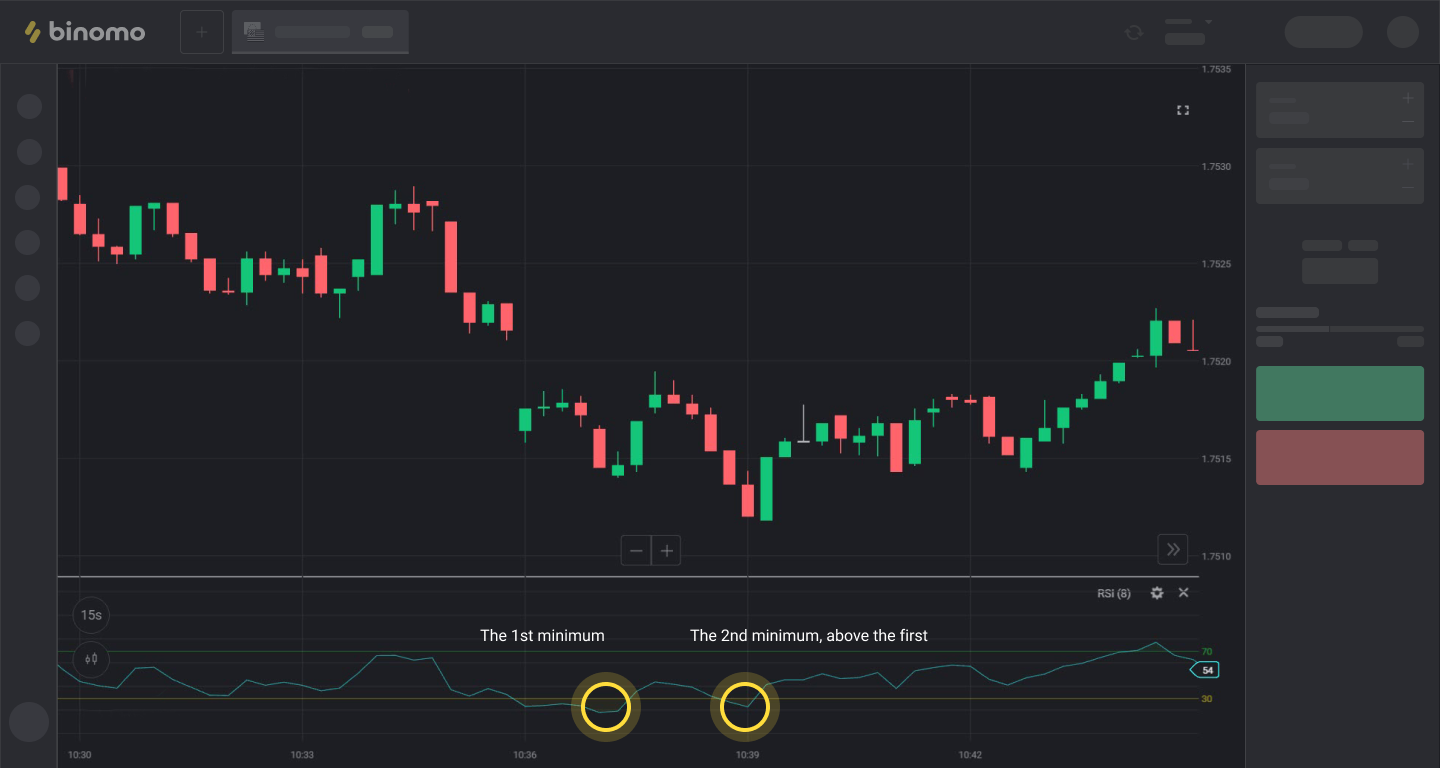
How to conclude trades UP
- We wait until the RSI drops below level 30 and forms 2 minimums there. And the 2nd should be above the first:
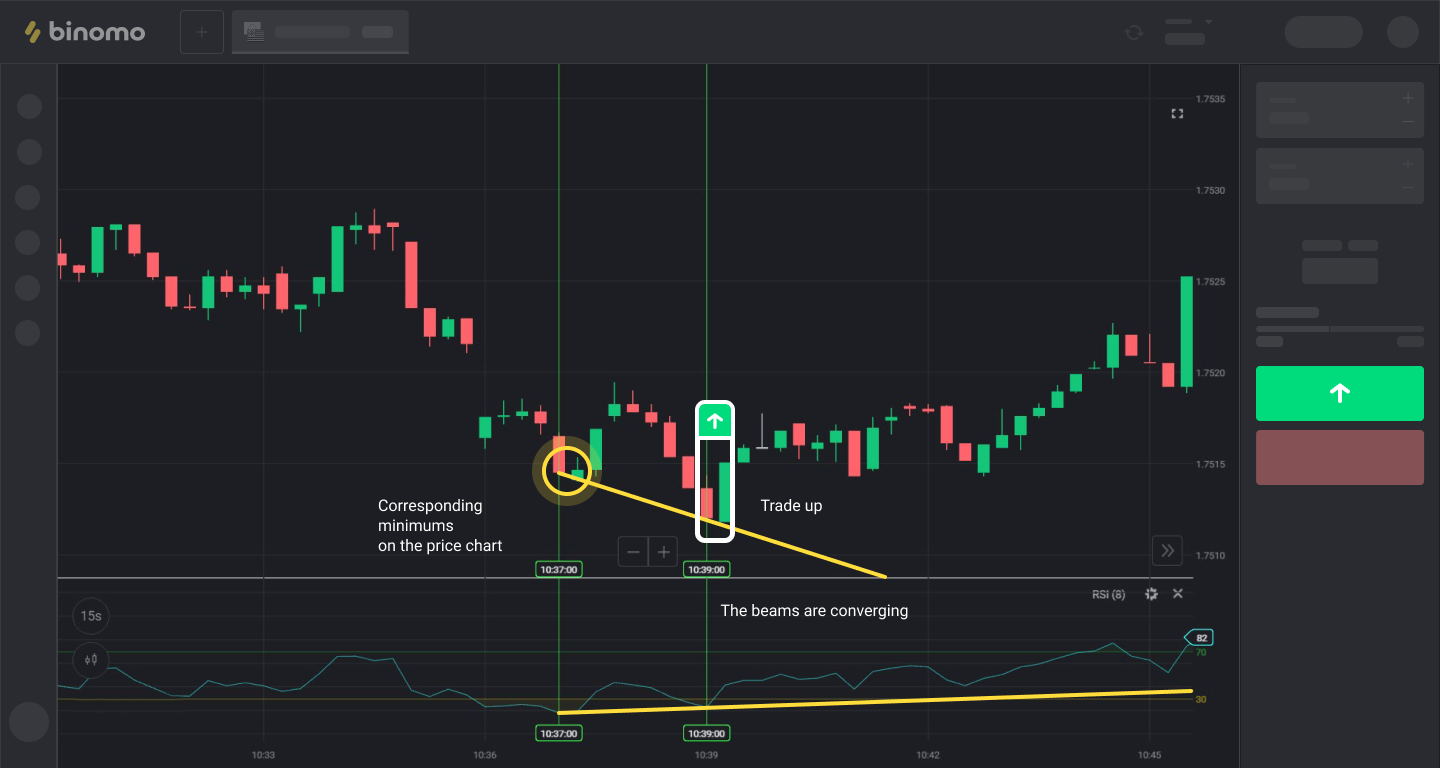
In the "Tools" tab, select "Beam" and draw the beam from left to right directly through the minimums on the RSI indicator. We get an uptrend line.
On the chart, we draw the beam through the corresponding minimums in the same way. It is also a trend, but... a downward one.
When the upper beam is directed downwards and the lower beam is directed upwards, this is called convergence and it indicates a reversal UP.
- We conclude a trade UP for 1-5 minutes.
Important! If both beams are directed upwards, there is no convergence! We do not conclude a trade!
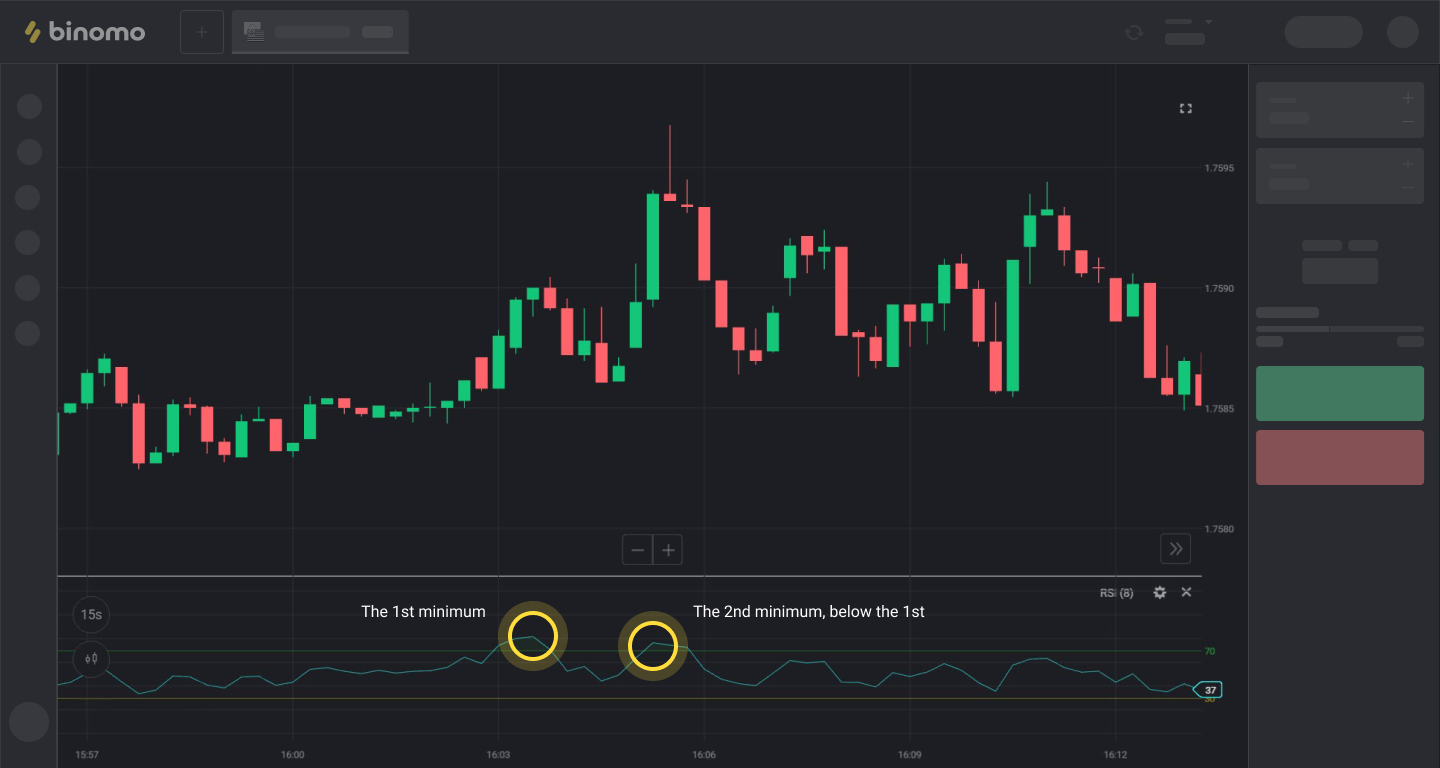
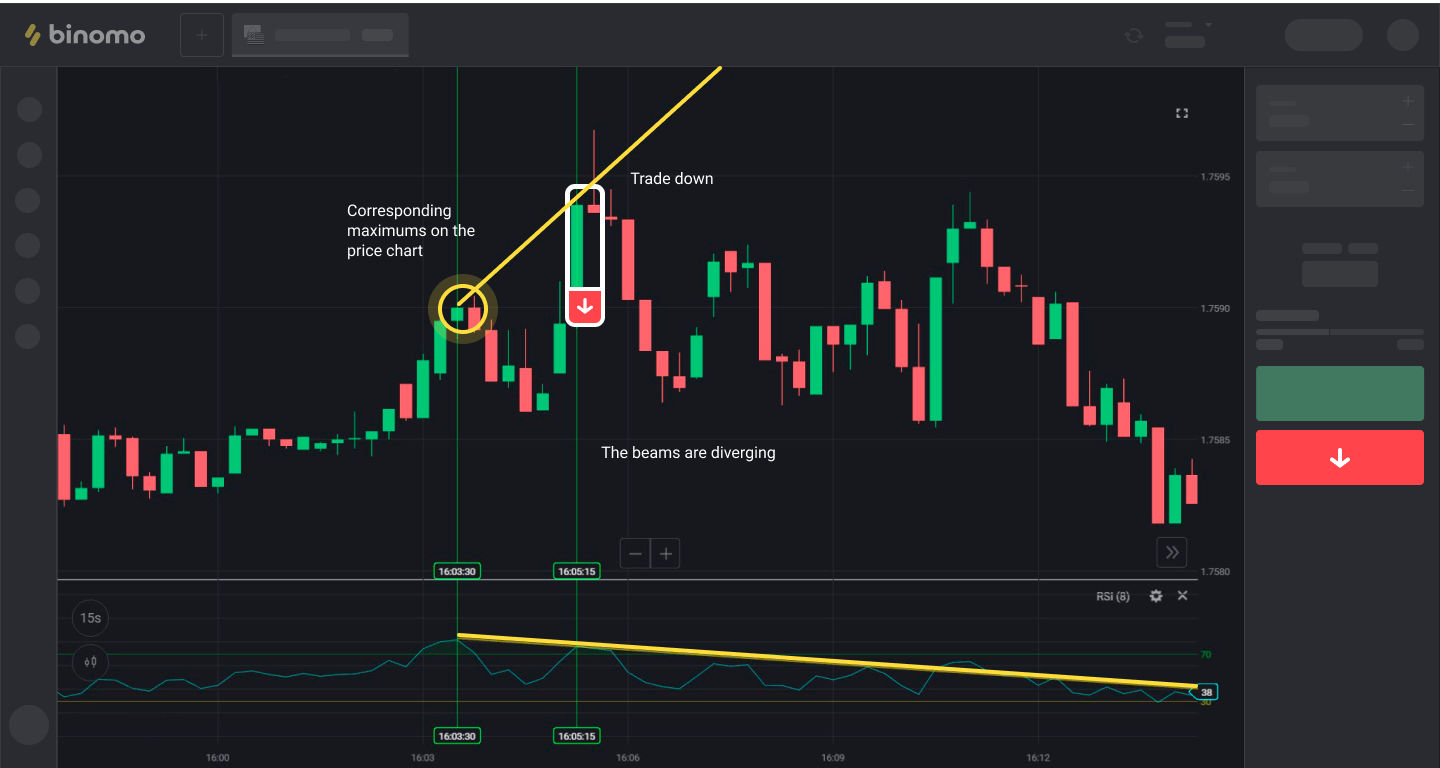
How to conclude trades DOWN
- We wait until the RSI rises above level 70 and forms 2 maximums there. And the 2nd should be below the first:
- In the "Tools" tab, select "Beam" and draw the beam from left to right directly through the maximums on the RSI indicator. We get a downward trend.
- On the chart, we draw the beam through the corresponding maximums. We get an upward trend.
When the upper beam is directed upwards and the lower beam is directed downwards, this is called divergence and it indicates a reversal DOWN.
We conclude a trade DOWN for 1-5 minutes.
Important! If both beams are directed downwards, there is no divergence! We do not conclude a trade!
P.S. With experience, you will be able to make more profitable trades, because you will learn to identify subtle at first glance market convergence/divergence, which usually indicates sharper, stronger, and more prolonged corrections and reversals.
.jpeg)

.jpeg)

Comments
Post a Comment