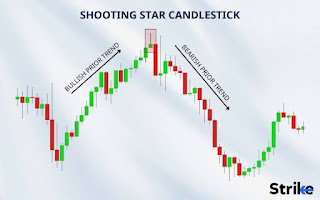
The Shooting Star Candlestick Pattern
.jpeg)
.jpeg)
The "Night channel" trading strategy
Trader level (Beginner)
Type of strategy (Flat)
Timeframe (60-300 m)
Assets to trade (Currency pairs)
When is the best time to trade—day or night? Have you learned how to identify trends, and manage your capital well, and do you have the skills to instantly react to changing market conditions? Then day trading is precisely what you need. But if you prefer to trade stress-free on a calm market, you should consider the potential of night trading. You might be able to earn even more and do it more easily at night!
What do we get from night trading?
At night, asset markets are in a sideways trend with little amplitude. So, with the right approach, we get the following:
• an almost 100% predictable market;
• slow movement of quotes, which will allow you to make trading decisions without haste or stress;
Thus, our night-time trading becomes much less risky, and often more profitable.
How can we trade profitably at night?
Now let's look at the most profitable night trading option. Based on the fact that the night market moves sideways with insignificant amplitude up to 90% of the time, that means trading within the price channel is the best way to go.
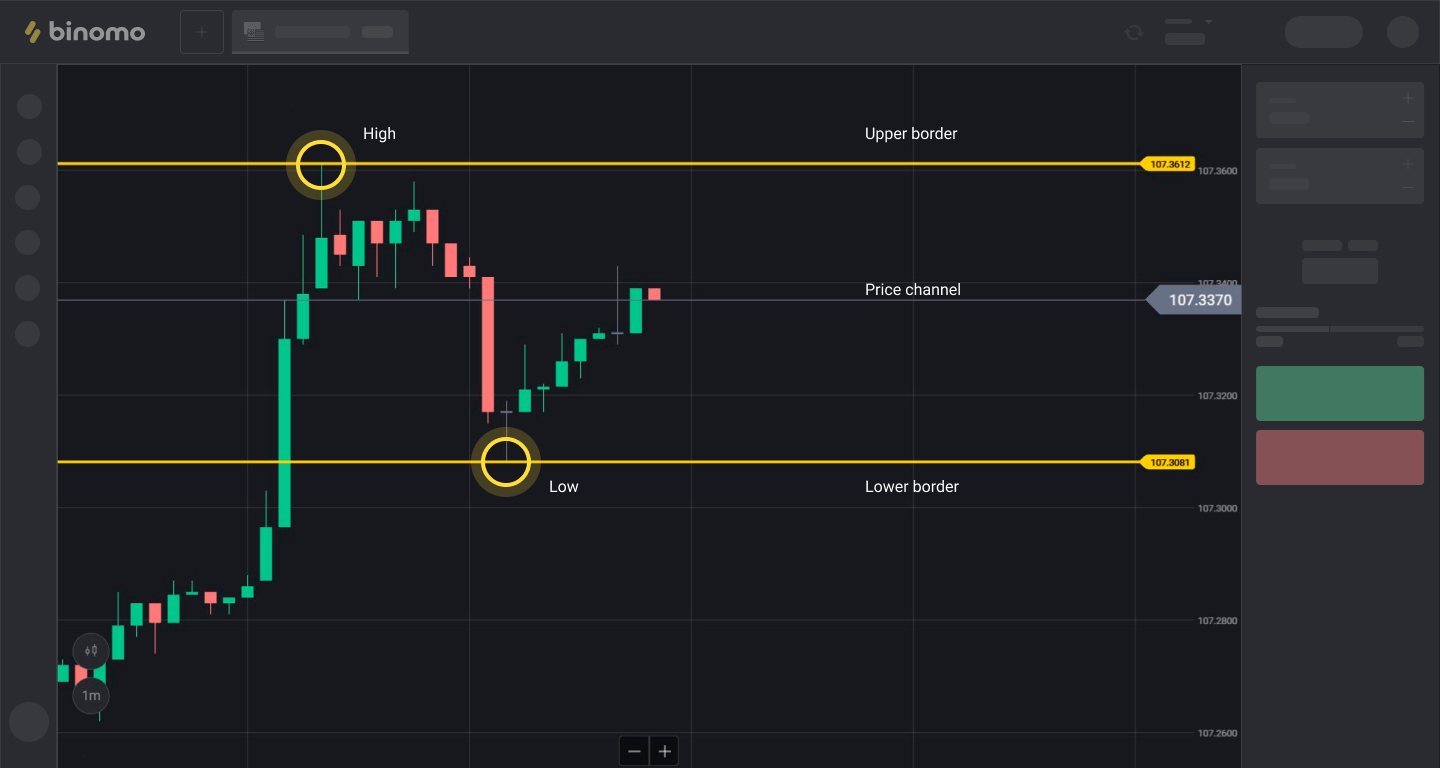
Step 1: Determining the price channel and its boundaries:
On the chart, a flat looks like a “horizontal” price movement. As soon as we notice one, we draw a line through the highs and lows of price movement—outlining the price channel in which we’re going to trade.

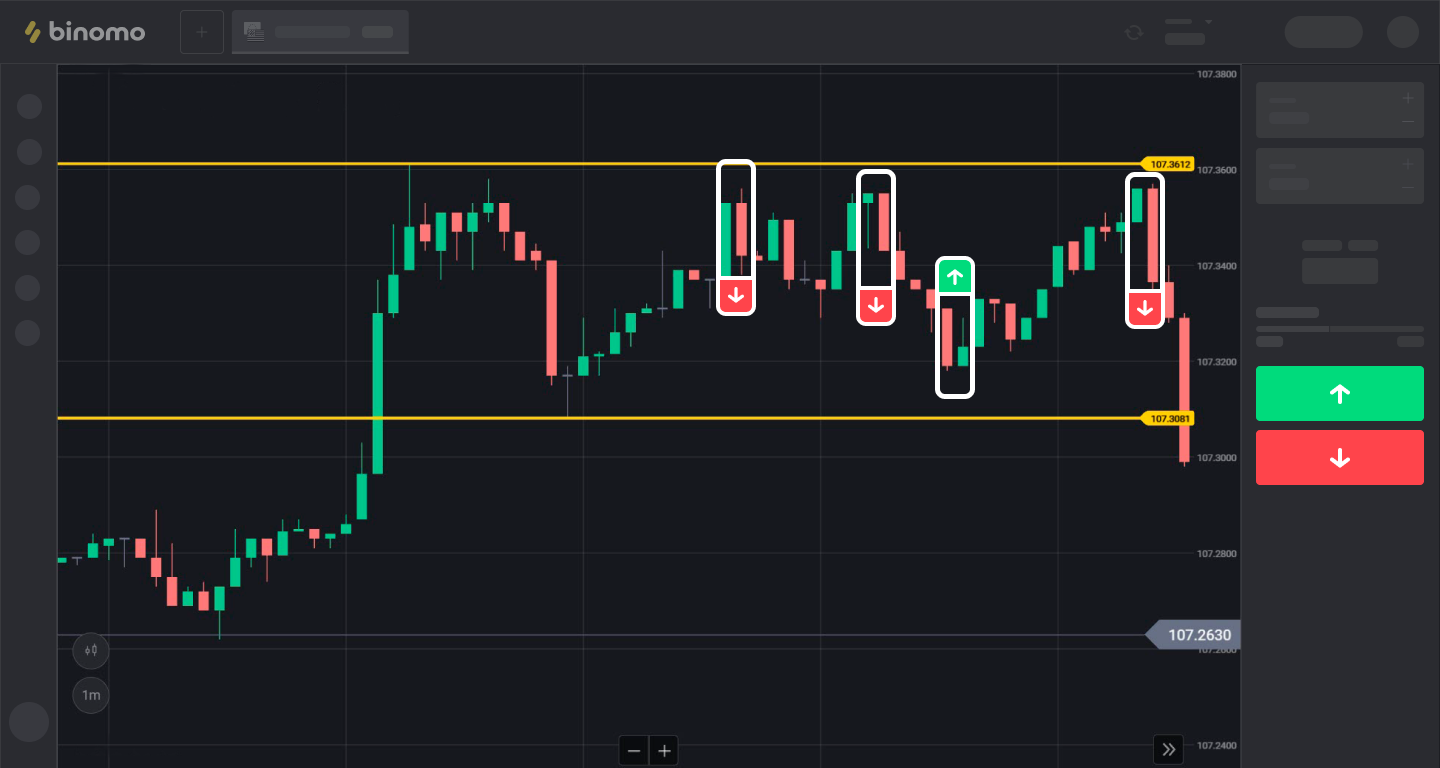
Step 2: Watching the chart and concluding trades:
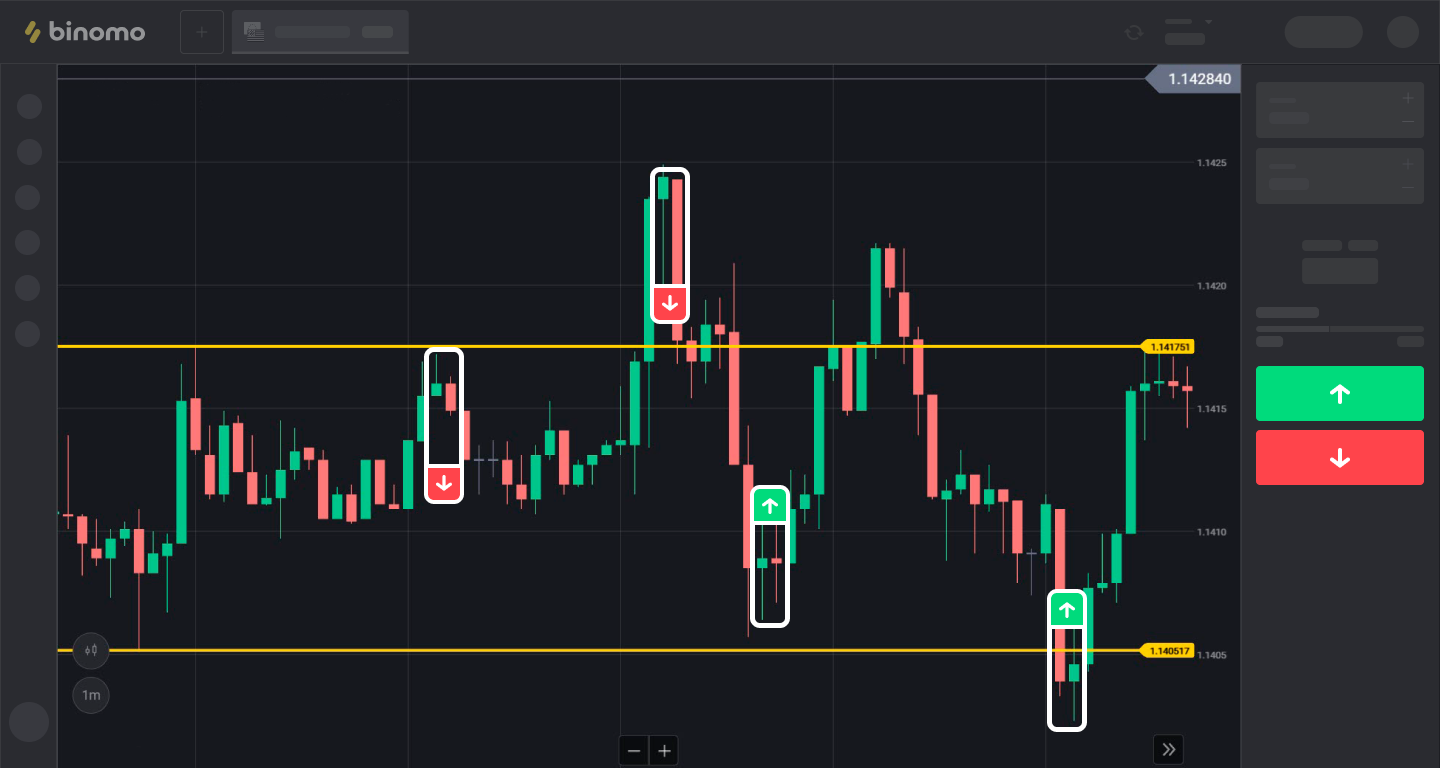
When the asset quote approaches the upper border of the price channel, we conclude a trade DOWN. Whesectionses approach the lower border, we conclude trades UP:

Even if the asset quotes break through the price channel you have defined, they are much more likely (at night in particular) to return inside the channel instead of changing direction.
Therefore, if the quotes go beyond the channel, you can conclude additional trades in the direction of the opposite border.

To make it less risky and costly in the event of a mistake, these trades can be concluded for smaller amounts than your main ones.
IMPORTANT: the number of "additional trades" when the price goes beyond the upper or lower border should not exceed two trades in a row.
Otherwise, if the quotes do not roll back in the direction we want (which is always possible when levels intersect), you will suffer additional losses!
Comments
Post a Comment