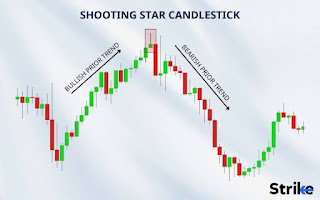
The Shooting Star Candlestick Pattern
.jpeg)
.jpeg)
Trading on Fibonacci levels
Trader level (Experienced)
Type of strategy (Trend)
Timeframe (60-300 m)
Assets to trade (Any)
The most effective trading tactic is trading on the main price movement — on the trend.
And the best moment to conclude a trade is the moment the price reverses along the trend after a lull, i.e., a flat. Or even short movement against the trend — price correction.
To determine when the price will reverse and follow the trend again, use the "Fibonacci Correction" tool, a unique technical analysis tool.
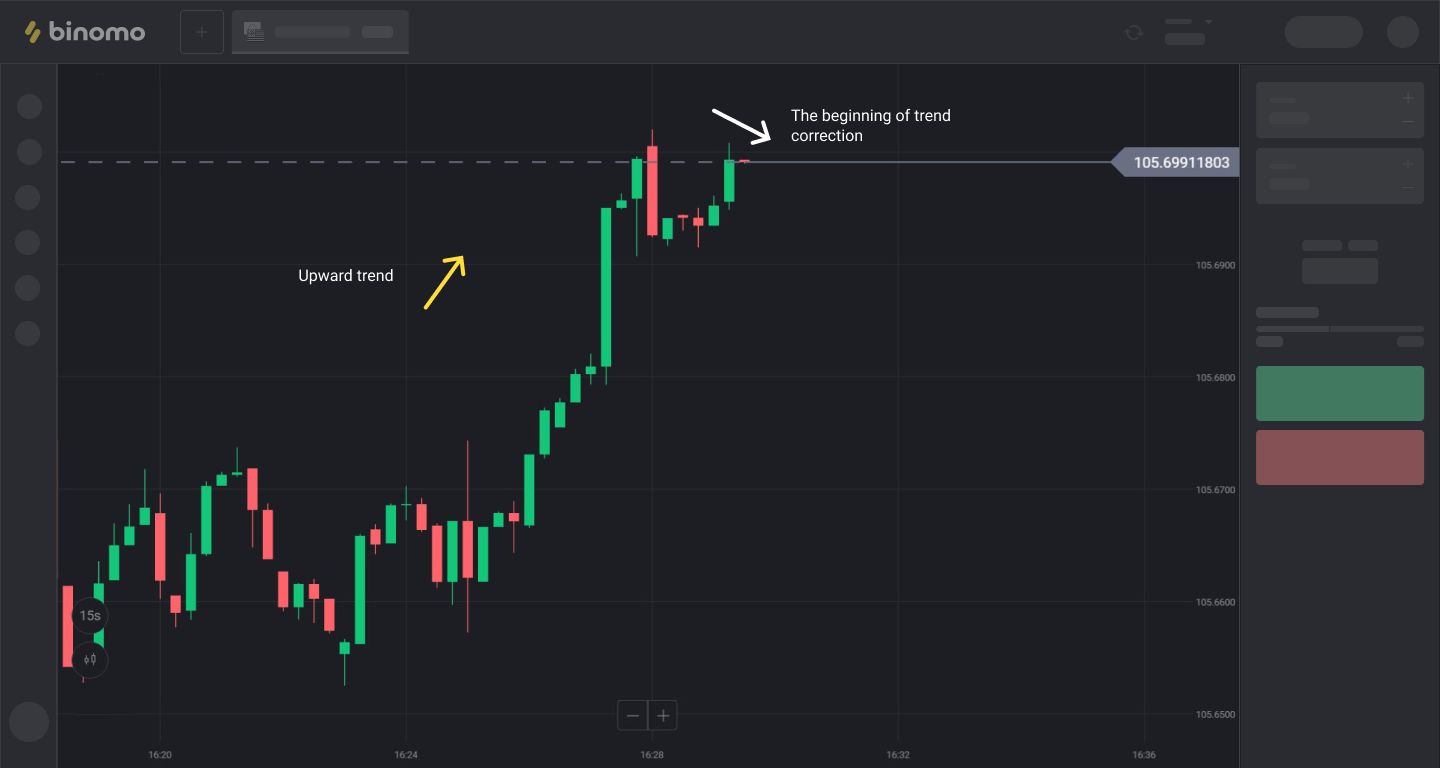
Step 1: Determining a trend with correction beginning
We observe the asset price movement, and wait until trend correction begins.
It usually looks something like this:
Step 2: Building Fibonacci levels
Select the Fibonacci Tool, type Extension.
We draw a Fibonacci grid on the quote chart: put the first point at the very beginning of the trend, the second at the very top.
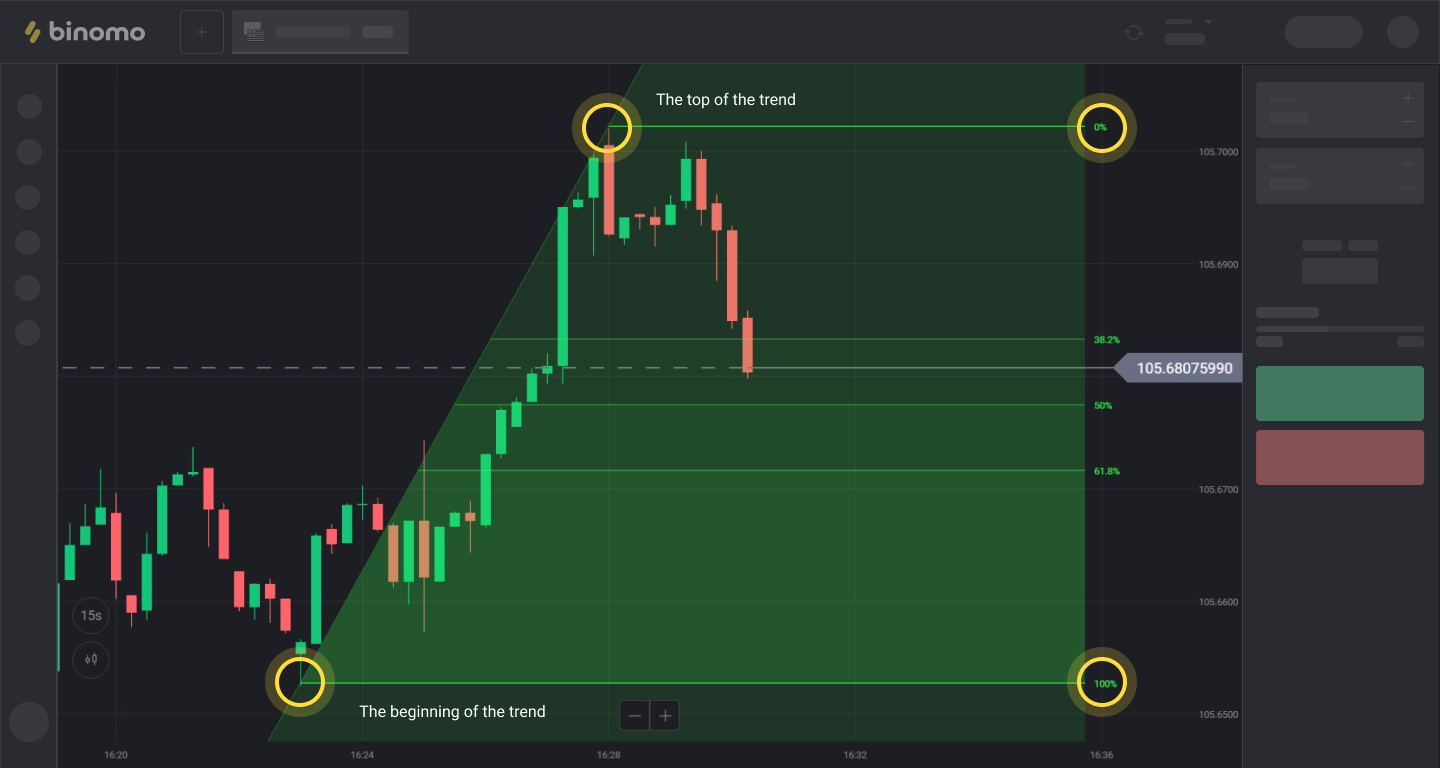
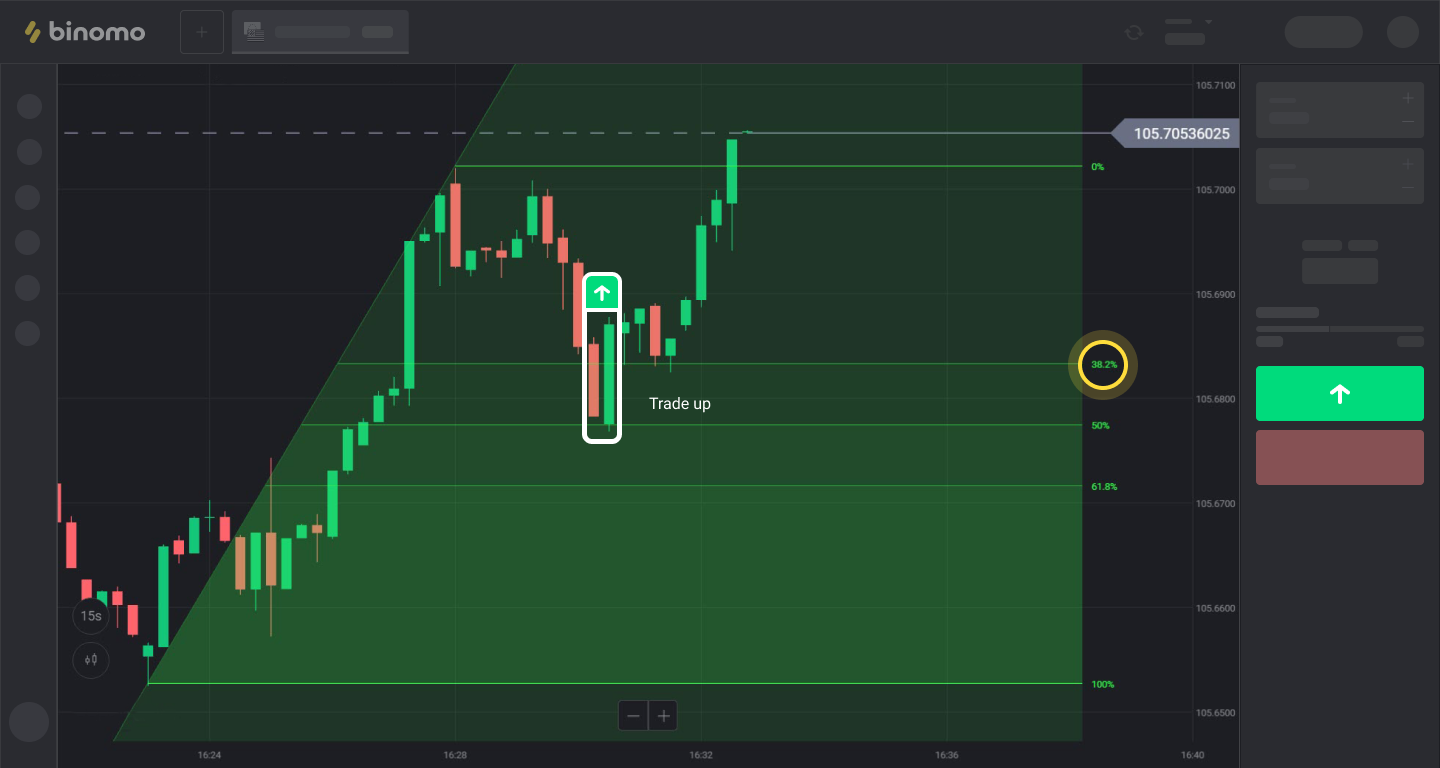
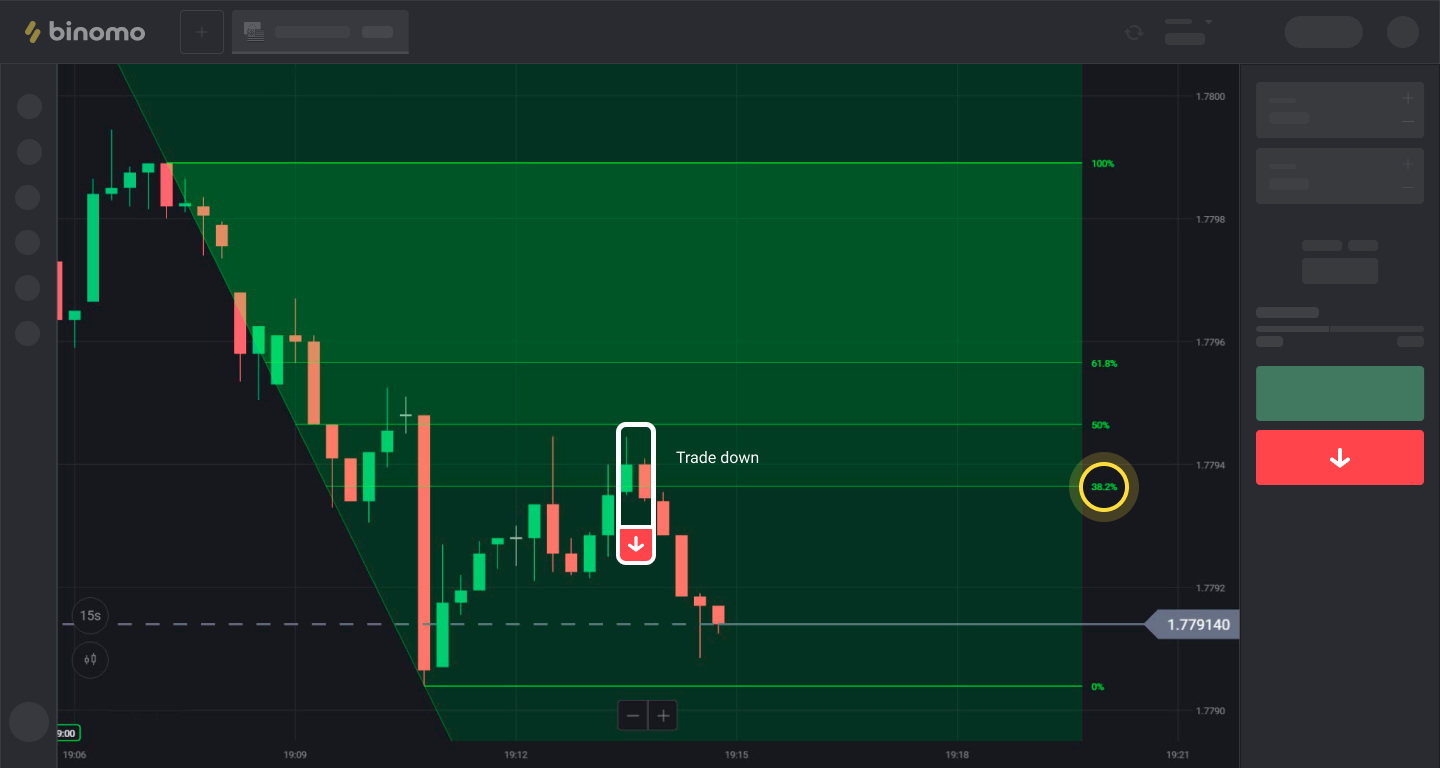
We now have reference levels: 38.2%; 50%, and 61.8%.
The thing is that in most cases, correction ends somewhere between those levels, and the price starts to follow the trend again.
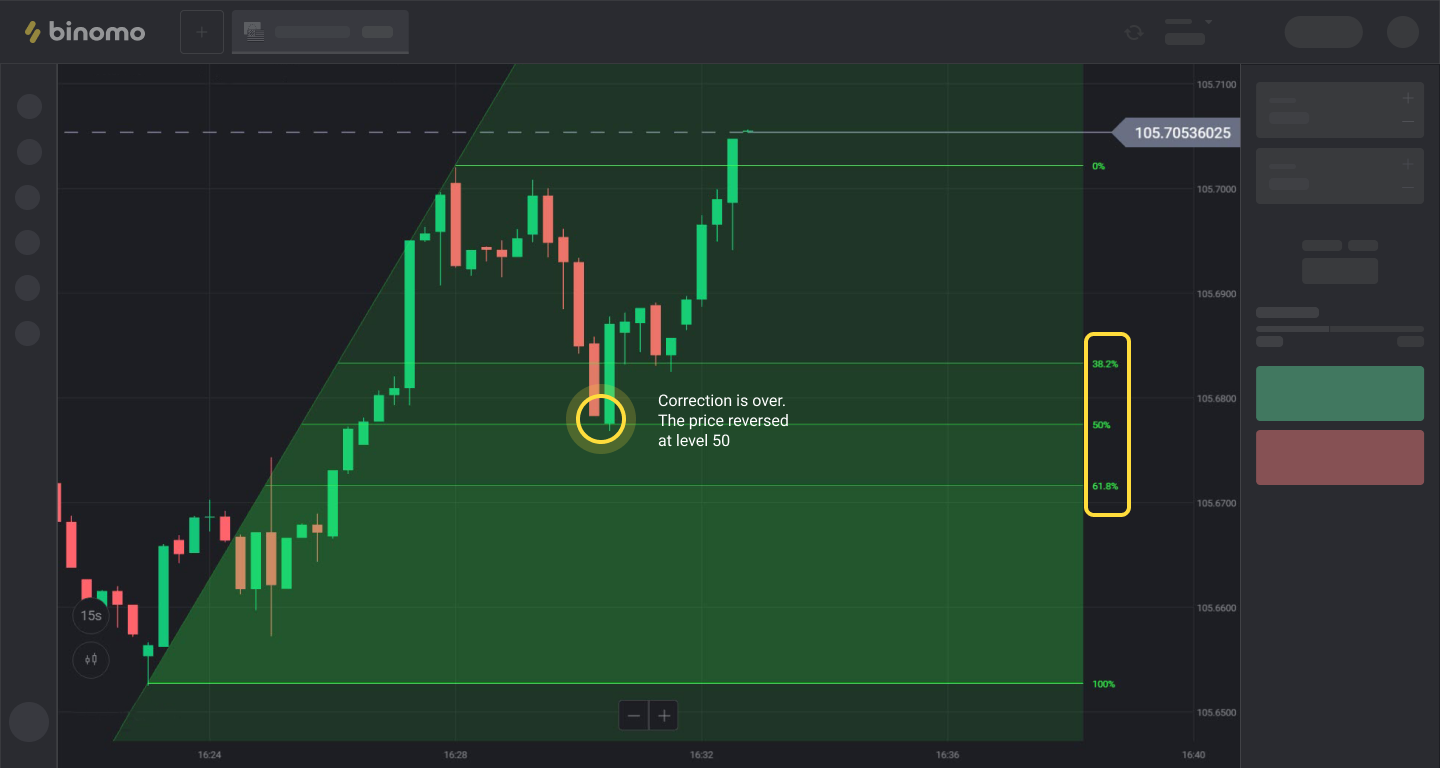
Knowing that, you can conclude successful trades.
Step 3: Using levels to conclude trades
Trade UP - on an uptrend when the price has already reversed up from the level 61.8% or 50%, and the price candle CLOSES ABOVE the 38.2% level
Trade DOWN - on a downtrend when the price has already reversed down from the level 61.8% or 50%, and the price candle CLOSES BELOW the 38.2% level
IMPORTANT!
Trades are concluded for a period of 3 to 12 candles, depending on the intensity of price movement and the time frame being analyzed.
Comments
Post a Comment