Posts

Showing posts from June, 2024

The Shooting Star Candlestick Pattern
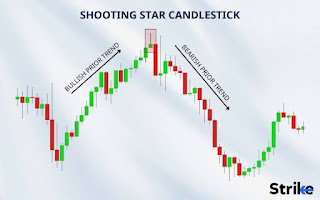
Image
 ### The Shooting Star Candlestick Pattern #### Description The Shooting Star is a bearish reversal candlestick pattern that typically appears at the top of an uptrend. It is characterized by a small real body near the lower end of the trading range, a long upper wick (shadow), and little or no lower wick. The long upper wick indicates that the market opened, rallied significantly, but then gave up most of the gains to close near the opening price. #### Characteristics - **Small Real Body**: Indicates minimal difference between the opening and closing prices. - **Long Upper Wick**: Reflects strong upward movement that was not sustained. - **Short or Absent Lower Wick**: Suggests limited lower price movement during the period. #### Significance The Shooting Star pattern signals that buyers initially drove prices higher, but sellers regained control, pushing prices back down. This shift in momentum from bullish to bearish suggests a potential reversal from an uptrend to a downtrend. ...

How to Use the Fibonacci Indicator in Trading

Image
 ## How to Use the Fibonacci Indicator in Trading The Fibonacci indicator is a popular technical analysis tool used by traders to identify potential reversal levels and forecast price movements in financial markets. Based on the Fibonacci sequence, this tool helps traders determine support and resistance levels. Here’s a comprehensive guide on how to use the Fibonacci indicator effectively in your trading strategy. ### Understanding the Fibonacci Sequence The Fibonacci sequence is a series of numbers where each number is the sum of the two preceding ones, usually starting with 0 and 1. The sequence looks like this: 0, 1, 1, 2, 3, 5, 8, 13, 21, and so on. In trading, the key Fibonacci ratios are derived from this sequence, notably 23.6%, 38.2%, 50%, 61.8%, and 100%. ### Fibonacci Retracement Levels Fibonacci retracement levels are horizontal lines that indicate potential support and resistance levels. These levels are derived from the Fibonacci sequence and are used to predict the f...

how to use the MACD indicator

Image
 The Moving Average Convergence Divergence (MACD) is a popular technical analysis tool used in trading to identify potential buy and sell signals. Here's a basic guide on how to use the MACD indicator: 1. **Understanding MACD Components**:    - **MACD Line**: The difference between the 12-day and 26-day exponential moving averages (EMAs).    - **Signal Line**: A 9-day EMA of the MACD line.    - **Histogram**: The difference between the MACD line and the Signal line, displayed as bars. 2. **Setting Up the MACD**:    - Most trading platforms have the MACD indicator available. Typically, the default settings are (12, 26, 9). 3. **Interpreting MACD Signals**:    - **MACD Line Crosses Above Signal Line**: This is a bullish signal, suggesting it might be a good time to buy.    - **MACD Line Crosses Below Signal Line**: This is a bearish signal, suggesting it might be a good time to sell.    - **Histogram**: When the hi...

How to use RSI Indicator

Image
### How to Use the RSI Indicator The Relative Strength Index (RSI) is a popular momentum oscillator used by traders to evaluate the strength of a security's price movement and identify potential reversal points. Here's a step-by-step guide on how to effectively use the RSI indicator. #### 1. Setting Up the RSI Indicator 1. **Choose Your Trading Platform**: Most trading platforms like MetaTrader, TradingView, or broker-provided platforms offer the RSI indicator as a built-in tool. 2. **Add the RSI Indicator**: Locate the RSI in the list of technical indicators and add it to your chart. 3. **Set the Parameters**: The default setting for RSI is a 14-day period, but you can adjust this depending on your trading style. Shorter periods (e.g., 7 days) make RSI more sensitive, while longer periods (e.g., 21 days) make it smoother. #### 2. Interpreting RSI Readings 1. **Overbought and Oversold Levels**:    - **Overbought**: When RSI is above 70, it suggests that the asset may be overbo...

10 Best Strategies for Effective Trading earn money

Image
**10 Best Strategies for Effective Trading** Trading can be a highly rewarding but equally challenging endeavor. To navigate the complexities of the financial markets, traders need a well-rounded approach and a robust strategy. Here are ten of the best strategies to enhance your trading success: ### 1. **Develop a Trading Plan** A comprehensive trading plan is essential. It should include your goals, risk tolerance, trading methods, and criteria for entering and exiting trades. A solid plan helps maintain discipline and consistency. ### 2. **Conduct Thorough Research** Stay informed about the assets you trade, whether they are stocks, currencies, or commodities. Fundamental and technical analysis can provide insights into market trends and potential trading opportunities. ### 3. **Implement Risk Management** Effective risk management is crucial to long-term success. Use stop-loss orders to limit potential losses and never risk more than a small percentage of your trading capital on a s...

Popular posts from this blog

How to Use the Fibonacci Indicator in Trading

Technical indicators

The "Night channel" trading strategy