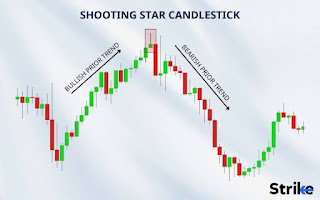
The Shooting Star Candlestick Pattern
.jpeg)
.jpeg)
The Moving Average Convergence Divergence (MACD) is a popular technical analysis tool used in trading to identify potential buy and sell signals. Here's a basic guide on how to use the MACD indicator:
1. **Understanding MACD Components**:
- **MACD Line**: The difference between the 12-day and 26-day exponential moving averages (EMAs).
- **Signal Line**: A 9-day EMA of the MACD line.
- **Histogram**: The difference between the MACD line and the Signal line, displayed as bars.
2. **Setting Up the MACD**:
- Most trading platforms have the MACD indicator available. Typically, the default settings are (12, 26, 9).
3. **Interpreting MACD Signals**:
- **MACD Line Crosses Above Signal Line**: This is a bullish signal, suggesting it might be a good time to buy.
- **MACD Line Crosses Below Signal Line**: This is a bearish signal, suggesting it might be a good time to sell.
- **Histogram**: When the histogram is above the zero line, it indicates upward momentum. When it’s below, it indicates downward momentum.
4. **Using MACD for Divergence**:
- **Bullish Divergence**: Occurs when the price makes a lower low, but the MACD makes a higher low. This can signal a potential reversal to the upside.
- **Bearish Divergence**: Occurs when the price makes a higher high, but the MACD makes a lower high. This can signal a potential reversal to the downside.
5. **Confirming with Other Indicators**:
- While the MACD can be a powerful tool, it's often best to confirm signals with other indicators or analysis techniques, such as the Relative Strength Index (RSI), volume analysis, or support and resistance levels.
6. **Practice and Backtesting**:
- Practice using the MACD on historical data to understand how it performs in different market conditions. This can help in developing a strategy that works for your specific trading style.
By using the MACD indicator in combination with other analysis methods, traders can better identify potential trading opportunities and make more informed decisions.
Comments
Post a Comment