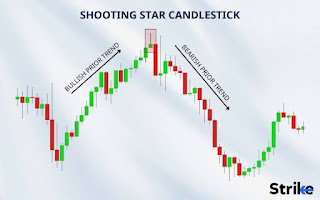
The Shooting Star Candlestick Pattern
.jpeg)
.jpeg)
## How to Use the Fibonacci Indicator in Trading
The Fibonacci indicator is a popular technical analysis tool used by traders to identify potential reversal levels and forecast price movements in financial markets. Based on the Fibonacci sequence, this tool helps traders determine support and resistance levels. Here’s a comprehensive guide on how to use the Fibonacci indicator effectively in your trading strategy.
### Understanding the Fibonacci Sequence
The Fibonacci sequence is a series of numbers where each number is the sum of the two preceding ones, usually starting with 0 and 1. The sequence looks like this: 0, 1, 1, 2, 3, 5, 8, 13, 21, and so on. In trading, the key Fibonacci ratios are derived from this sequence, notably 23.6%, 38.2%, 50%, 61.8%, and 100%.
### Fibonacci Retracement Levels
Fibonacci retracement levels are horizontal lines that indicate potential support and resistance levels. These levels are derived from the Fibonacci sequence and are used to predict the future movement of asset prices. The main retracement levels are 23.6%, 38.2%, 50%, 61.8%, and 100%.
### Steps to Use Fibonacci Retracement Levels
1. **Identify the Trend**: Before applying the Fibonacci retracement levels, identify the current trend of the market. If the market is in an uptrend, you will draw the Fibonacci retracement from the swing low to the swing high. Conversely, if the market is in a downtrend, draw from the swing high to the swing low.
2. **Draw the Fibonacci Levels**: Use a charting software or trading platform that supports Fibonacci retracement tools. Select the Fibonacci retracement tool and draw it from the beginning to the end of the identified trend.
3. **Analyze the Levels**: Once the Fibonacci retracement levels are drawn, you will see the horizontal lines representing the key retracement levels. These levels act as potential areas of support and resistance.
4. **Look for Confluence**: Confluence occurs when multiple indicators suggest the same support or resistance level. Look for areas where Fibonacci retracement levels align with other technical indicators, such as moving averages, trendlines, or previous support and resistance levels.
5. **Monitor Price Action**: Observe how the price reacts when it approaches the Fibonacci levels. If the price respects a Fibonacci level and reverses direction, it may indicate a strong support or resistance area. Look for confirmation through candlestick patterns, volume, or other technical indicators before making trading decisions.
### Fibonacci Extensions
While Fibonacci retracement levels are used to identify potential pullback areas, Fibonacci extensions are used to forecast potential price targets during an ongoing trend. Common extension levels include 161.8%, 261.8%, and 423.6%.
### Using Fibonacci Extensions
1. **Identify the Trend and Retracement**: Determine the trend direction and the retracement levels as described earlier.
2. **Draw the Extensions**: After identifying a retracement, use the Fibonacci extension tool to draw from the trend's beginning to its end and back to the retracement level.
3. **Set Target Levels**: The extension levels will appear on the chart, providing potential price targets where the market might find resistance or support as it continues in the trend direction.
### Best Practices
- **Combine with Other Indicators**: Fibonacci levels work best when combined with other technical analysis tools, such as moving averages, RSI, MACD, and candlestick patterns.
- **Risk Management**: Always use proper risk management techniques, including stop-loss orders, to protect against unexpected market movements.
- **Practice and Backtesting**: Practice using Fibonacci retracement and extension tools on historical data to understand how they work in different market conditions.
### Conclusion
The Fibonacci indicator is a versatile tool that can help traders identify key levels of support and resistance, set price targets, and improve their trading strategies. By understanding and applying Fibonacci retracement and extension levels, traders can gain valuable insights into market dynamics and make more informed trading decisions. Remember to combine Fibonacci analysis with other technical indicators and maintain disciplined risk management practices for the best results.
Comments
Post a Comment