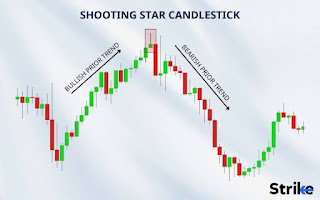
The Shooting Star Candlestick Pattern
.jpeg)
.jpeg)
### How to Use the RSI Indicator
The Relative Strength Index (RSI) is a popular momentum oscillator used by traders to evaluate the strength of a security's price movement and identify potential reversal points. Here's a step-by-step guide on how to effectively use the RSI indicator.
#### 1. Setting Up the RSI Indicator
1. **Choose Your Trading Platform**: Most trading platforms like MetaTrader, TradingView, or broker-provided platforms offer the RSI indicator as a built-in tool.
2. **Add the RSI Indicator**: Locate the RSI in the list of technical indicators and add it to your chart.
3. **Set the Parameters**: The default setting for RSI is a 14-day period, but you can adjust this depending on your trading style. Shorter periods (e.g., 7 days) make RSI more sensitive, while longer periods (e.g., 21 days) make it smoother.
#### 2. Interpreting RSI Readings
1. **Overbought and Oversold Levels**:
- **Overbought**: When RSI is above 70, it suggests that the asset may be overbought and due for a pullback.
- **Oversold**: When RSI is below 30, it suggests that the asset may be oversold and due for a bounce.
2. **RSI Ranges**:
- **0 to 30**: Strongly oversold.
- **30 to 50**: Moderately weak.
- **50**: Neutral.
- **50 to 70**: Moderately strong.
- **70 to 100**: Strongly overbought.
#### 3. Trading Strategies Using RSI
1. **Overbought/Oversold Strategy**:
- **Buy Signal**: Look to buy when RSI crosses below 30 and then rises back above it. This indicates the asset is recovering from an oversold condition.
- **Sell Signal**: Look to sell when RSI crosses above 70 and then falls back below it. This indicates the asset is starting to decline from an overbought condition.
2. **Divergence Strategy**:
- **Bullish Divergence**: Occurs when the price makes a new low, but RSI makes a higher low. This indicates a potential upward reversal.
- **Bearish Divergence**: Occurs when the price makes a new high, but RSI makes a lower high. This indicates a potential downward reversal.
3. **Trend Confirmation**:
- **Uptrend**: RSI values above 50 generally indicate that the market is in an uptrend. Look for buying opportunities.
- **Downtrend**: RSI values below 50 generally indicate that the market is in a downtrend. Look for selling opportunities.
4. **RSI Trendline Strategy**:
- Draw trendlines on the RSI chart itself. Breaks of these trendlines can indicate potential reversals or continuations in price trends.
#### 4. Combining RSI with Other Indicators
1. **Moving Averages**: Combine RSI with moving averages to confirm signals. For example, a buy signal might be stronger if RSI crosses above 30 while the price is above its moving average.
2. **MACD**: Use the MACD indicator alongside RSI to confirm momentum changes.
3. **Bollinger Bands**: Identify overbought and oversold conditions using both Bollinger Bands and RSI for better accuracy.
#### 5. Practical Tips
1. **Adjust Time Frames**: Use different time frames for RSI depending on your trading style. Day traders might prefer shorter periods, while long-term investors might use longer periods.
2. **Avoid Using RSI in Isolation**: Always complement RSI with other indicators and analysis methods to increase the reliability of your signals.
3. **Understand Market Conditions**: RSI works best in ranging markets. In strongly trending markets, it might give false signals. Be aware of the broader market context when using RSI.
4. **Backtest Your Strategy**: Before applying any RSI-based strategy in live trading, backtest it on historical data to understand its performance and make necessary adjustments.
#### Conclusion
The RSI indicator is a powerful tool for traders when used correctly. By understanding how to interpret its readings, applying various strategies, and combining it with other technical indicators, you can improve your trading decisions and potentially enhance your trading results. Always remember to practice risk management and continuously refine your approach based on market conditions and your trading experience.
Comments
Post a Comment