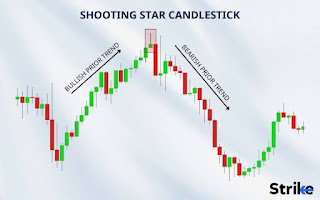
The Shooting Star Candlestick Pattern
.jpeg)
.jpeg)
### Understanding Candlestick Chart Patterns: A Comprehensive Guide
Candlestick charts are a popular tool used in trading to predict future price movements based on historical patterns. These charts are composed of individual "candles," each representing a specific time period and providing visual insight into the market's behavior. The body of the candle shows the opening and closing prices, while the wicks (or shadows) indicate the high and low prices within that period.
Here's a comprehensive guide to the most common candlestick patterns, including both single-candle and multiple-candle formations.
#### Single-Candle Patterns
1. **Doji**
- **Description**: A Doji occurs when the opening and closing prices are virtually the same, resulting in a very small body.
- **Significance**: Indicates indecision in the market; can signal a potential reversal when found at the top or bottom of trends.
2. **Hammer**
- **Description**: A short body with a long lower wick and little or no upper wick.
- **Significance**: Bullish reversal pattern, often found at the bottom of a downtrend.
3. **Hanging Man**
- **Description**: Similar to the Hammer but appears at the end of an uptrend.
- **Significance**: Bearish reversal pattern, suggesting the uptrend might be coming to an end.
4. **Shooting Star**
- **Description**: A short body with a long upper wick and little or no lower wick.
- **Significance**: Bearish reversal pattern, typically found at the top of an uptrend.
5. **Inverted Hammer**
- **Description**: A short body with a long upper wick and little or no lower wick.
- **Significance**: Bullish reversal pattern, usually seen at the bottom of a downtrend.
#### Two-Candle Patterns
1. **Bullish Engulfing**
- **Description**: A smaller bearish candle followed by a larger bullish candle that completely engulfs the previous candle.
- **Significance**: Bullish reversal pattern, indicating strong buying pressure.
2. **Bearish Engulfing**
- **Description**: A smaller bullish candle followed by a larger bearish candle that completely engulfs the previous candle.
- **Significance**: Bearish reversal pattern, indicating strong selling pressure.
3. **Tweezer Tops and Bottoms**
- **Description**: Two candles with matching highs (Tweezer Tops) or matching lows (Tweezer Bottoms).
- **Significance**: Reversal patterns, suggesting a change in trend direction.
#### Three-Candle Patterns
1. **Morning Star**
- **Description**: A bearish candle followed by a small-bodied candle (can be bullish or bearish), and then a bullish candle.
- **Significance**: Bullish reversal pattern, indicating the end of a downtrend.
2. **Evening Star**
- **Description**: A bullish candle followed by a small-bodied candle (can be bullish or bearish), and then a bearish candle.
- **Significance**: Bearish reversal pattern, indicating the end of an uptrend.
3. **Three White Soldiers**
- **Description**: Three consecutive long bullish candles with progressively higher closes.
- **Significance**: Strong bullish reversal pattern, suggesting a strong uptrend.
4. **Three Black Crows**
- **Description**: Three consecutive long bearish candles with progressively lower closes.
- **Significance**: Strong bearish reversal pattern, suggesting a strong downtrend.
#### Continuation Patterns
1. **Rising Three Methods**
- **Description**: A bullish candle followed by a series of small bearish or neutral candles, then another bullish candle.
- **Significance**: Bullish continuation pattern, indicating the uptrend will likely continue.
2. **Falling Three Methods**
- **Description**: A bearish candle followed by a series of small bullish or neutral candles, then another bearish candle.
- **Significance**: Bearish continuation pattern, indicating the downtrend will likely continue.
### Practical Application
Understanding these candlestick patterns is crucial for traders as they provide insights into potential price movements. However, it is important to use these patterns in conjunction with other technical analysis tools and market indicators to make informed trading decisions.
### Conclusion
Candlestick chart patterns offer a visual and intuitive way to analyze market behavior and predict future price movements. By familiarizing yourself with these patterns and their significance, you can enhance your trading strategies and improve your ability to anticipate market changes. Remember, while candlestick patterns are powerful tools, they are most effective when used as part of a comprehensive trading plan that includes risk management and continuous learning.
---
I hope this comprehensive guide helps you understand the various candlestick patterns and their significance in trading. If you have any further questions or need more detailed explanations on specific patterns, feel free to ask!
Comments
Post a Comment