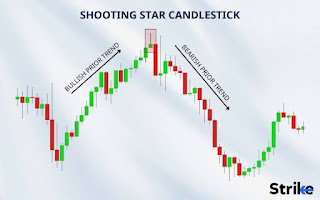
The Shooting Star Candlestick Pattern
.jpeg)
.jpeg)
### Mastering the Hammer Candlestick Pattern: A Comprehensive Guide for Traders
The hammer candlestick pattern is a popular tool among traders for identifying potential reversals in the market. Recognizable by its distinct shape, the hammer is a single-candle formation that signals a possible bullish reversal after a downtrend. This guide will explore the hammer candlestick pattern, how to identify it, and strategies for effectively using it in your trading.
#### What is a Hammer Candlestick Pattern?
A hammer candlestick pattern forms at the bottom of a downtrend and is characterized by a small body with a long lower shadow. The key features of a hammer candlestick are:
1. **Small Real Body**: The distance between the open and close prices is small, indicating indecision among traders.
2. **Long Lower Shadow**: The lower shadow should be at least twice the length of the real body, showing that sellers pushed prices down during the session, but buyers regained control before the close.
3. **Little to No Upper Shadow**: The absence of an upper shadow (or a very small one) signifies that the close was near the session's high.
#### Identifying the Hammer Candlestick Pattern
To accurately identify a hammer candlestick pattern, look for the following:
1. **Downtrend Preceding the Hammer**: Ensure the market is in a clear downtrend before the hammer appears. This context is crucial as it increases the likelihood of a reversal.
2. **Hammer Shape**: Confirm the small body and long lower shadow. The color of the body (green or red) is less important but a green body can be slightly more bullish.
#### Confirming the Pattern
While the hammer itself can signal a potential reversal, confirmation through subsequent price action increases its reliability:
1. **Volume**: Higher trading volume on the day of the hammer indicates stronger conviction among traders.
2. **Next Candlestick**: A strong bullish candlestick following the hammer serves as confirmation. Ideally, the next candle should close above the hammer's high, indicating continued buying pressure.
#### Trading Strategies Using the Hammer Candlestick
1. **Entry Points**: After identifying and confirming a hammer, consider entering a long position. Entering immediately after the confirmation candle can be an effective strategy.
2. **Stop Loss Placement**: Place a stop loss below the low of the hammer to manage risk. This ensures that if the market moves against your position, losses are minimized.
3. **Target Setting**: Set your profit targets based on key resistance levels, moving averages, or Fibonacci retracement levels to maximize gains.
#### Practical Examples
**Example 1:**
- **Scenario**: The market has been in a downtrend.
- **Hammer Identified**: A hammer forms with a small green body and a long lower shadow.
- **Confirmation**: The next day, a strong bullish candle forms, closing above the hammer's high.
- **Action**: Enter a long position with a stop loss below the hammer's low.
**Example 2:**
- **Scenario**: A stock in a downtrend shows a hammer with a red body but significant volume.
- **Confirmation**: The following day, a bullish engulfing pattern appears.
- **Action**: Enter a long trade, with a stop loss below the hammer’s low and a target at the next resistance level.
#### Common Mistakes to Avoid
1. **Ignoring Market Context**: Ensure that the hammer forms after a clear downtrend. A hammer in a sideways market or uptrend is less reliable.
2. **Lack of Confirmation**: Wait for confirmation before entering a trade. Jumping in without it increases the risk of false signals.
3. **Overlooking Volume**: High volume during the hammer formation adds credibility to the pattern. Low volume may indicate a weak reversal signal.
#### Conclusion
The hammer candlestick pattern is a valuable tool for traders looking to capitalize on potential market reversals. By understanding its formation, confirming the signal, and applying disciplined trading strategies, you can enhance your trading performance. Always combine the hammer pattern with other technical analysis tools and market context to increase its effectiveness. Happy trading!
---
This article provides a comprehensive overview of the hammer candlestick pattern, tailored for professional traders like you. If you need more detailed strategies or have specific trading scenarios in mind, feel free to ask!
Comments
Post a Comment