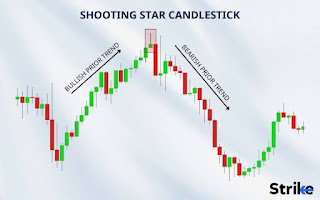
The Shooting Star Candlestick Pattern
.jpeg)
.jpeg)
## Fractal Choose Band Strategy: A Comprehensive Guide
### Introduction
The Fractal Choose Band Strategy is an advanced trading method combining fractal analysis with band indicators like Bollinger Bands or Keltner Channels. This strategy is particularly effective for identifying trend reversals and high-probability trade entries in various market conditions.
### Understanding Fractals
Fractals are repetitive patterns that appear on all time frames and are used by traders to identify potential reversals in the market. A fractal consists of a series of five consecutive bars:
- **Up Fractal**: The middle bar has the highest high, and the two bars on either side have lower highs.
- **Down Fractal**: The middle bar has the lowest low, and the two bars on either side have higher lows.
### The Role of Bands
Bands like Bollinger Bands or Keltner Channels are used to measure volatility and potential price levels where reversals or continuations might occur.
- **Bollinger Bands**: Consist of a middle SMA (simple moving average) and two standard deviations plotted above and below it.
- **Keltner Channels**: Use the ATR (average true range) to set the channel distance around an EMA (exponential moving average).
### Combining Fractals with Bands
The Fractal Choose Band Strategy integrates fractal signals with band indicators to enhance the reliability of trade signals.
### Key Components of the Strategy
1. **Fractal Identification**: Identify up and down fractals on the chart.
2. **Band Indicator**: Apply Bollinger Bands or Keltner Channels to the chart.
3. **Signal Confirmation**: Confirm fractal signals with band touches or breaks.
### Step-by-Step Guide
#### Step 1: Setting Up Your Chart
1. **Choose Your Chart**: Select your preferred trading instrument and time frame.
2. **Add Fractals**: Apply a fractal indicator to your chart.
3. **Add Bands**: Apply Bollinger Bands or Keltner Channels.

#### Step 2: Identifying Trade Signals
1. **Fractal Formation**: Wait for an up or down fractal to form.
2. **Band Interaction**: Observe how the price interacts with the bands. Look for fractal signals near the band edges.
#### Step 3: Entry Points
1. **Long Entry**: An up fractal forms near the lower band, indicating a potential bullish reversal.
2. **Short Entry**: A down fractal forms near the upper band, indicating a potential bearish reversal.

#### Step 4: Trade Management
1. **Stop Loss**: Place your stop loss a few pips below the recent swing low for long trades, or above the recent swing high for short trades.
2. **Take Profit**: Set your take profit at the opposite band or a key support/resistance level.
### Example Trades
#### Long Trade Example
1. **Setup**: An up fractal forms near the lower Bollinger Band.
2. **Entry**: Enter a long position at the next candle's open.
3. **Stop Loss**: Place a stop loss below the recent swing low.
4. **Take Profit**: Target the middle or upper Bollinger Band.

#### Short Trade Example
1. **Setup**: A down fractal forms near the upper Keltner Channel.
2. **Entry**: Enter a short position at the next candle's open.
3. **Stop Loss**: Place a stop loss above the recent swing high.
4. **Take Profit**: Target the middle or lower Keltner Channel.

### Tips for Success
1. **Backtest**: Always backtest the strategy on historical data before applying it in live markets.
2. **Risk Management**: Never risk more than 1-2% of your trading capital on a single trade.
3. **Market Conditions**: Be mindful of market conditions. This strategy works best in trending markets with clear band interactions.
### Conclusion
The Fractal Choose Band Strategy is a robust method for identifying high-probability trading opportunities. By combining fractal signals with band indicators, traders can improve their market entries and exits, enhancing their overall trading performance.
Remember to practice diligent risk management and continuously refine the strategy to suit your trading style and preferences. Happy trading!
---
If you need further details or have any specific questions about this strategy, feel free to reach out!
Comments
Post a Comment