Financial market players use many trading strategies and tactics. Elder's Triple Screen is one of the most effective, user-friendly, and professional trading techniques.
By using this system, you will always be trading in the direction of the main market trend and spot the best timing to make trades!
The key principle of the Triple Screen
The advantage that makes this strategy different from others is reliance on several time frames at a time for price analysis.
• You use the highest time frame (15M) to analyse the global trend to make trades only in its direction.
• You use the medium time frame (5M) to spot the beginning of new up and down waves.
• The lowest time frame (1M) is used for entering into profitable trades.
Step 1: Plotting indicators
Choose any trading asset available on the platform.
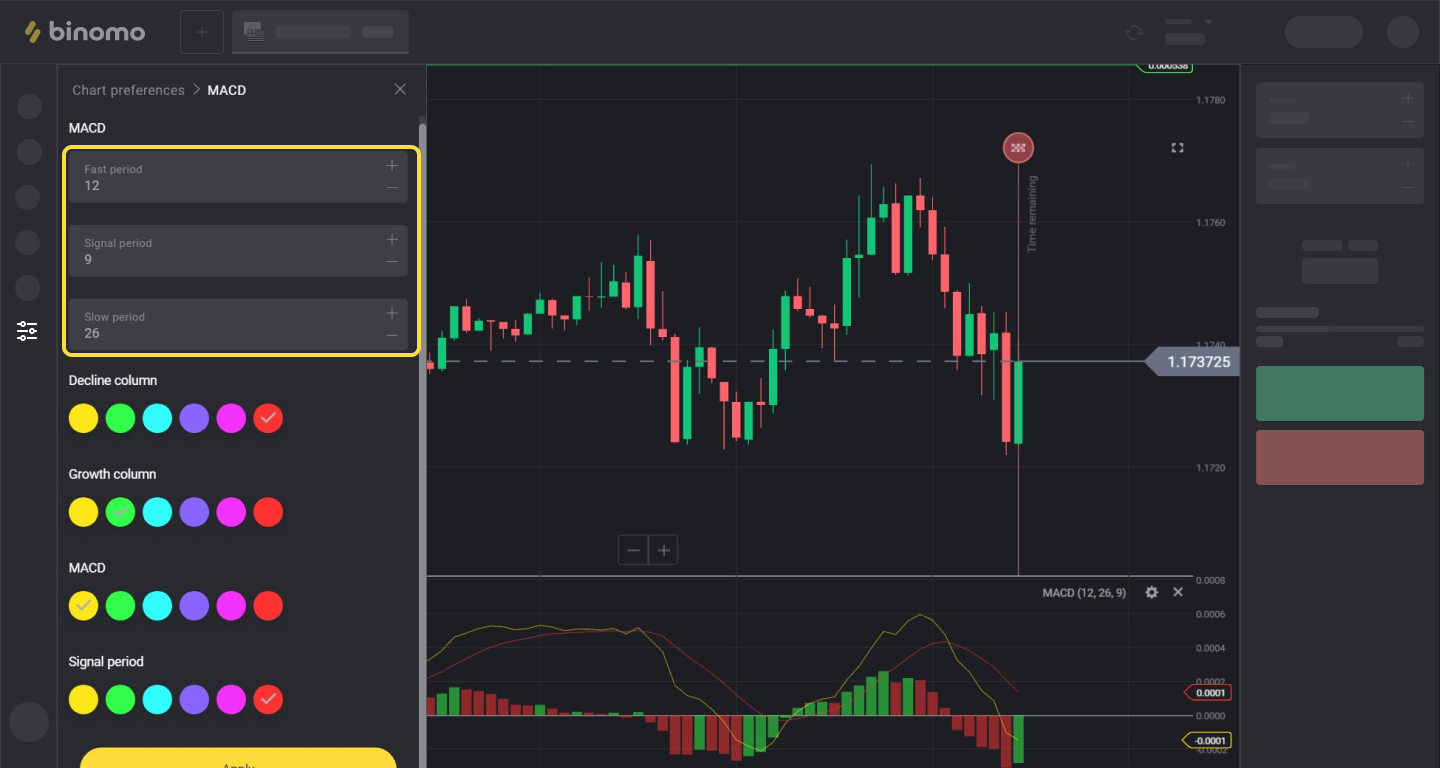
Plot MACD with default settings.
We will look at it on the 15M time frame to identify the main market trend.
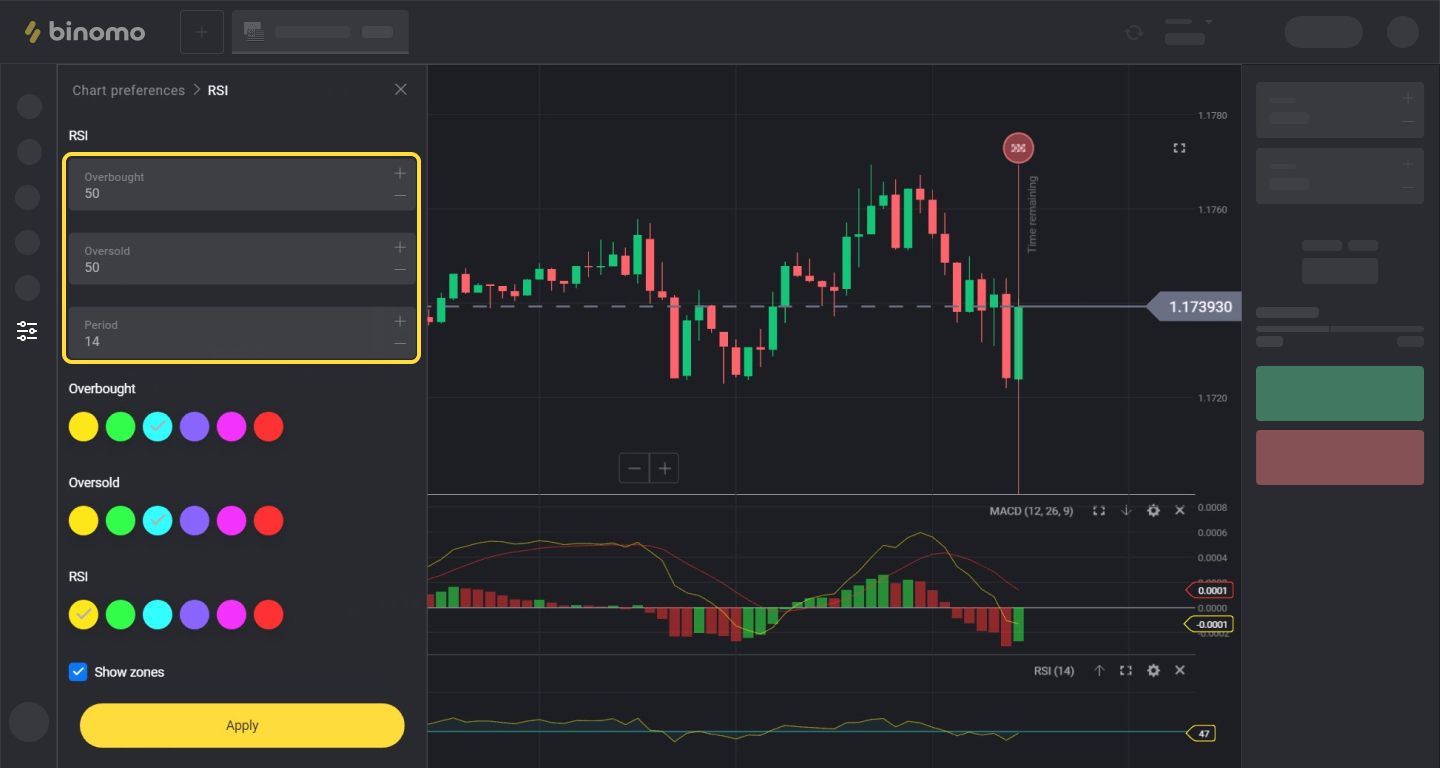
Add RSI with default settings and change its overbought/oversold levels to 50/50.
We will look at it on the 5M time frame to spot the start of new up and down waves.
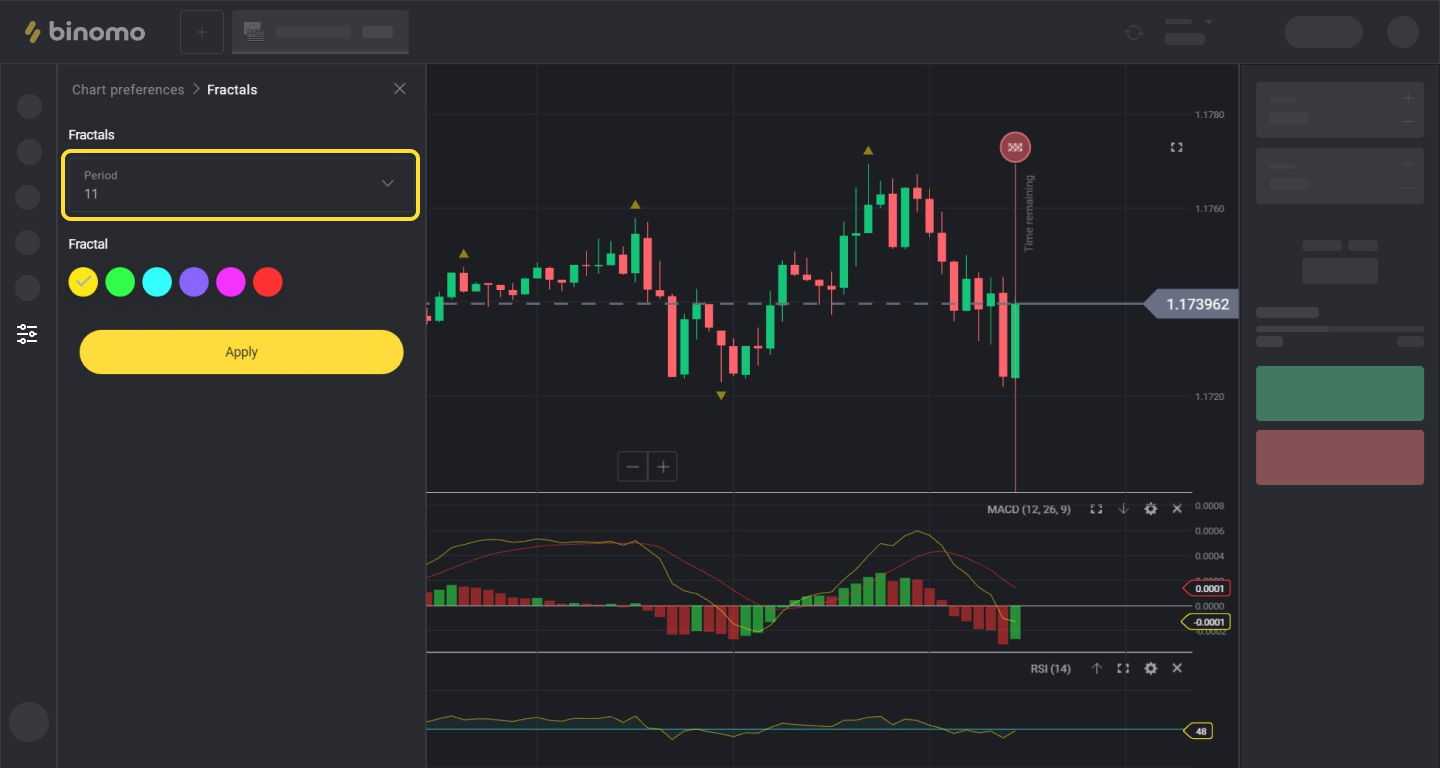
Add Fractals and set the period to 7 or even 11.
We will look at it on the 1M time frame to see local lows and highs of the price.
Step 2: Looking at the indicators and waiting for signals to enter into a trade
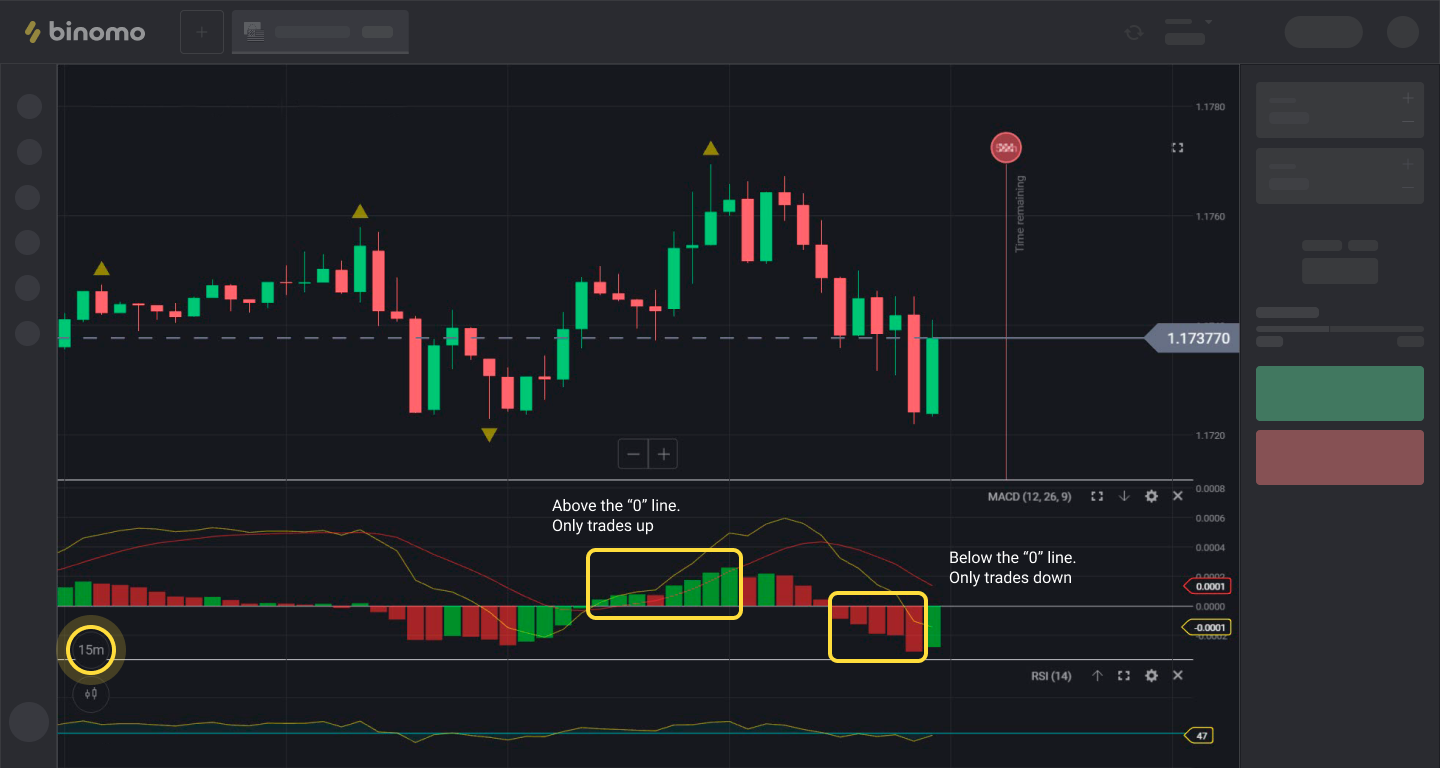
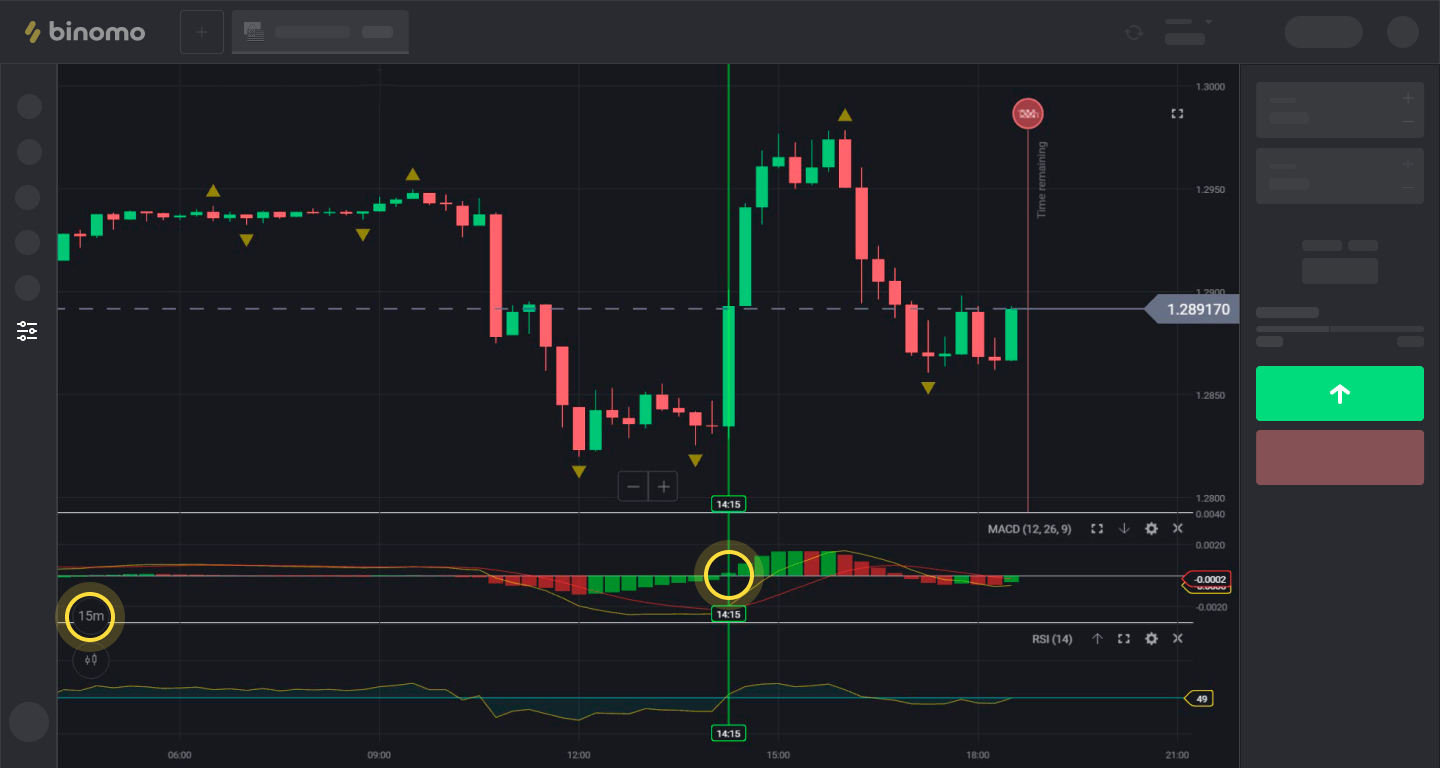
We switch the chart to TF 15M and look at MACD.
• If the histogram bars of the indicator are located above the zero level of the scale, the market is in an uptrend, and trades can only be made up
• If the histogram bars of the indicator are located below the zero level of the scale, the market is in a downtrend, and trades can only be made down
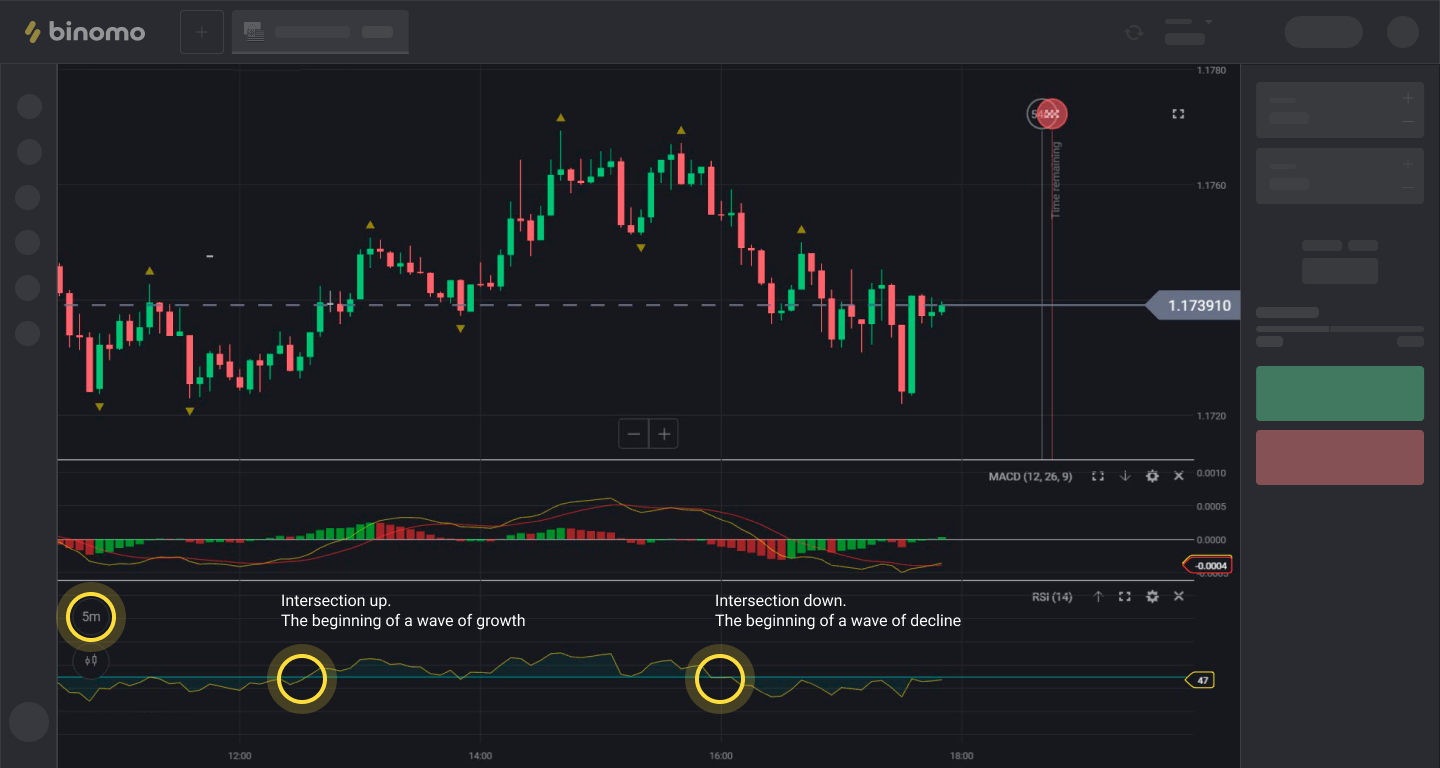
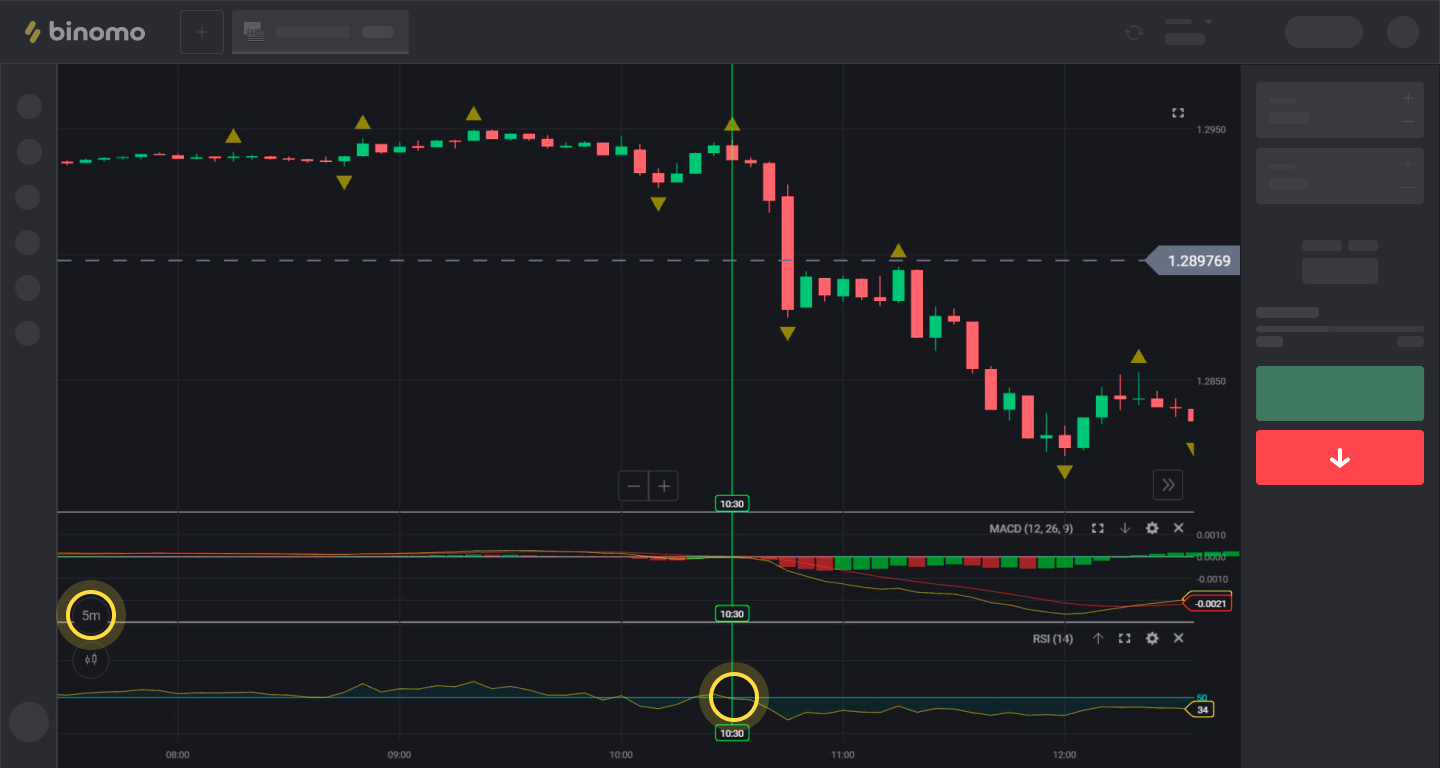
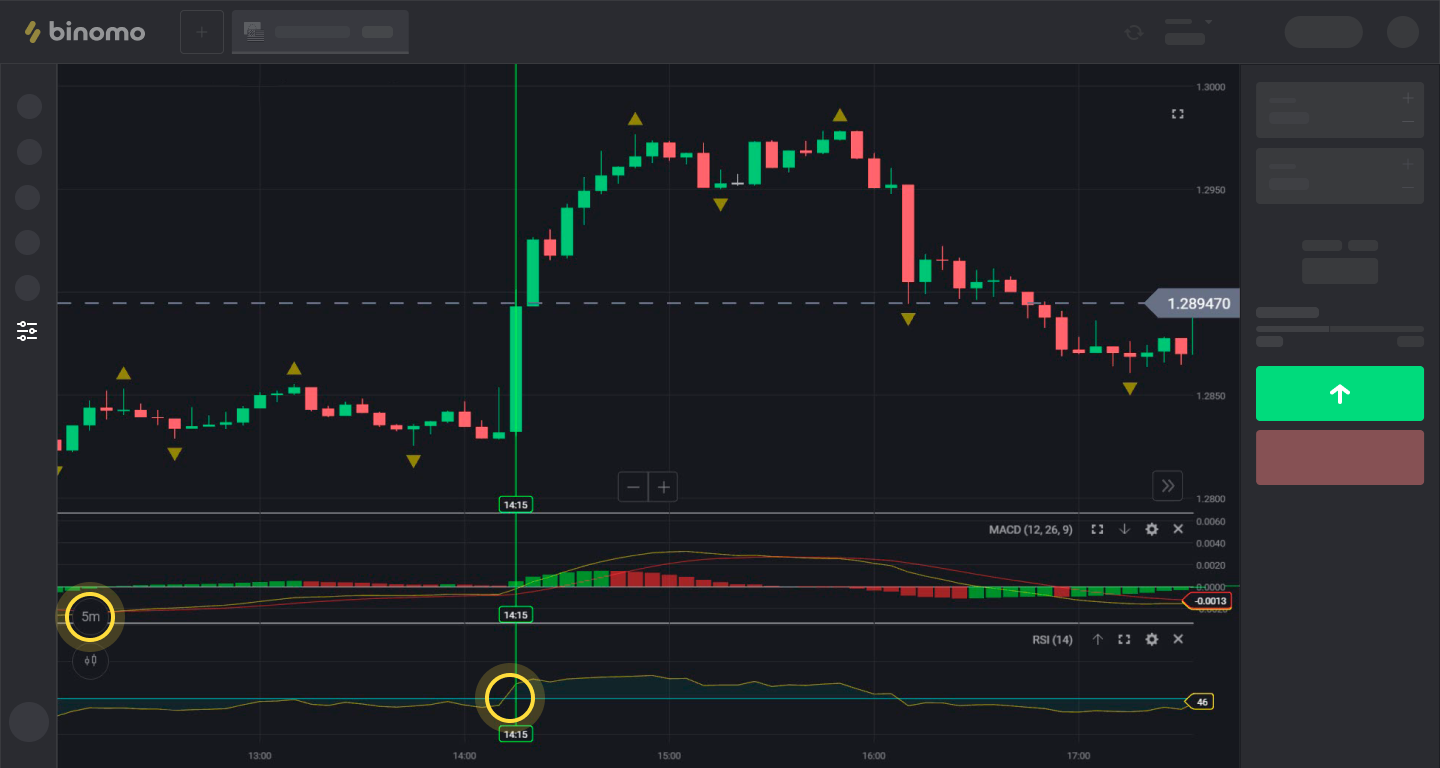
We switch the chart to TF 5M and look at RSI.
• If the RSI line crosses 50 up, an uptrend wave has begun
• If the RSI line crosses 50 down, a downtrend wave has begun
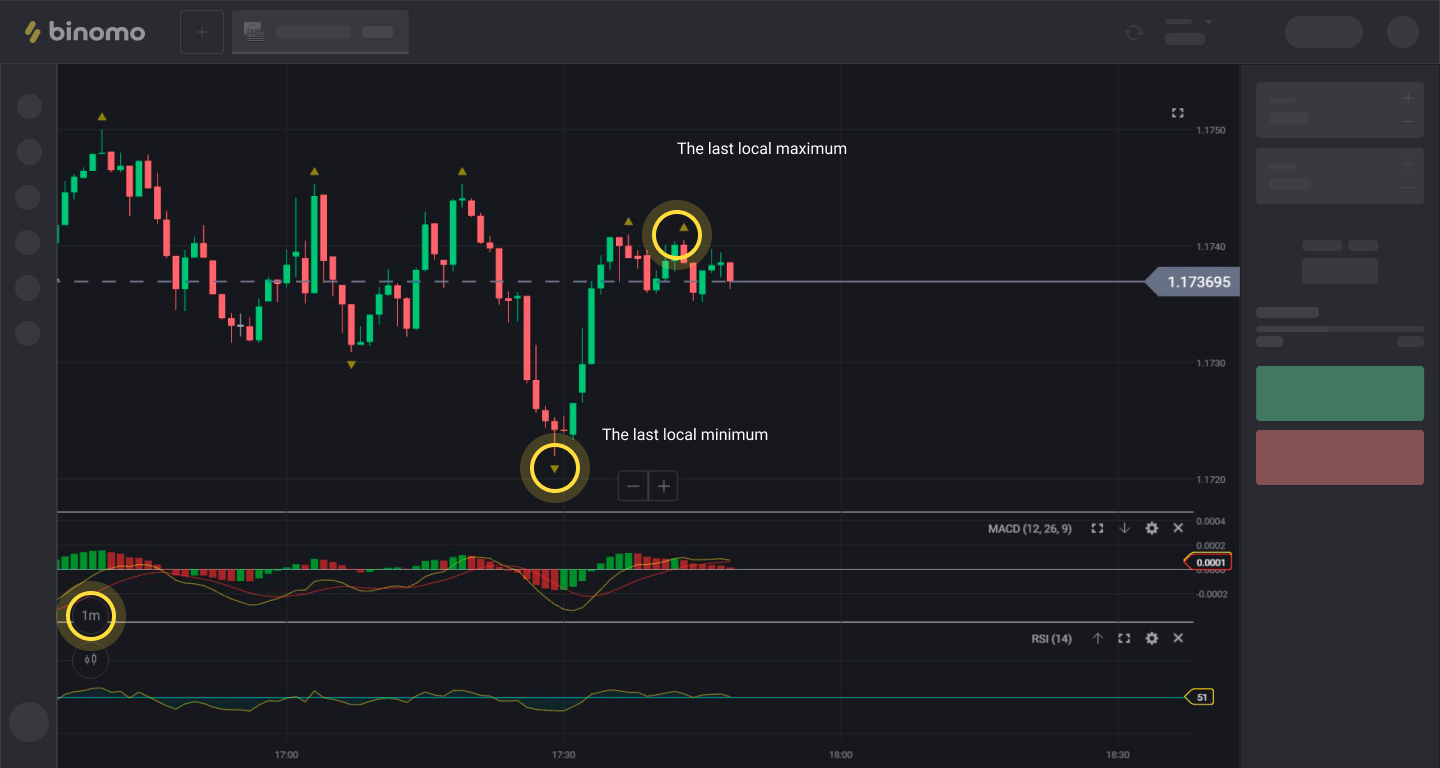
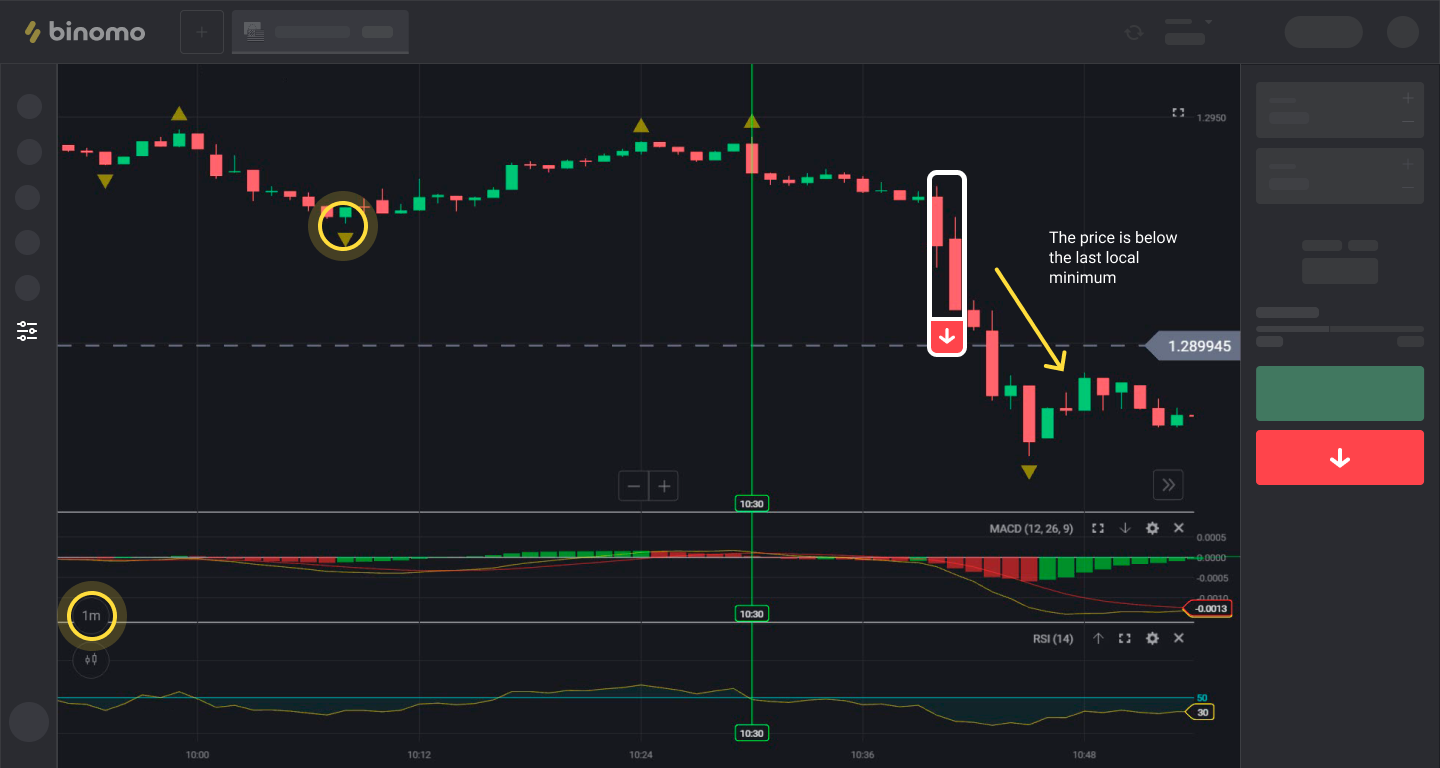
We switch the chart to TF 1M.
This is the TF we will be making trades on. We only focus on Fractals.
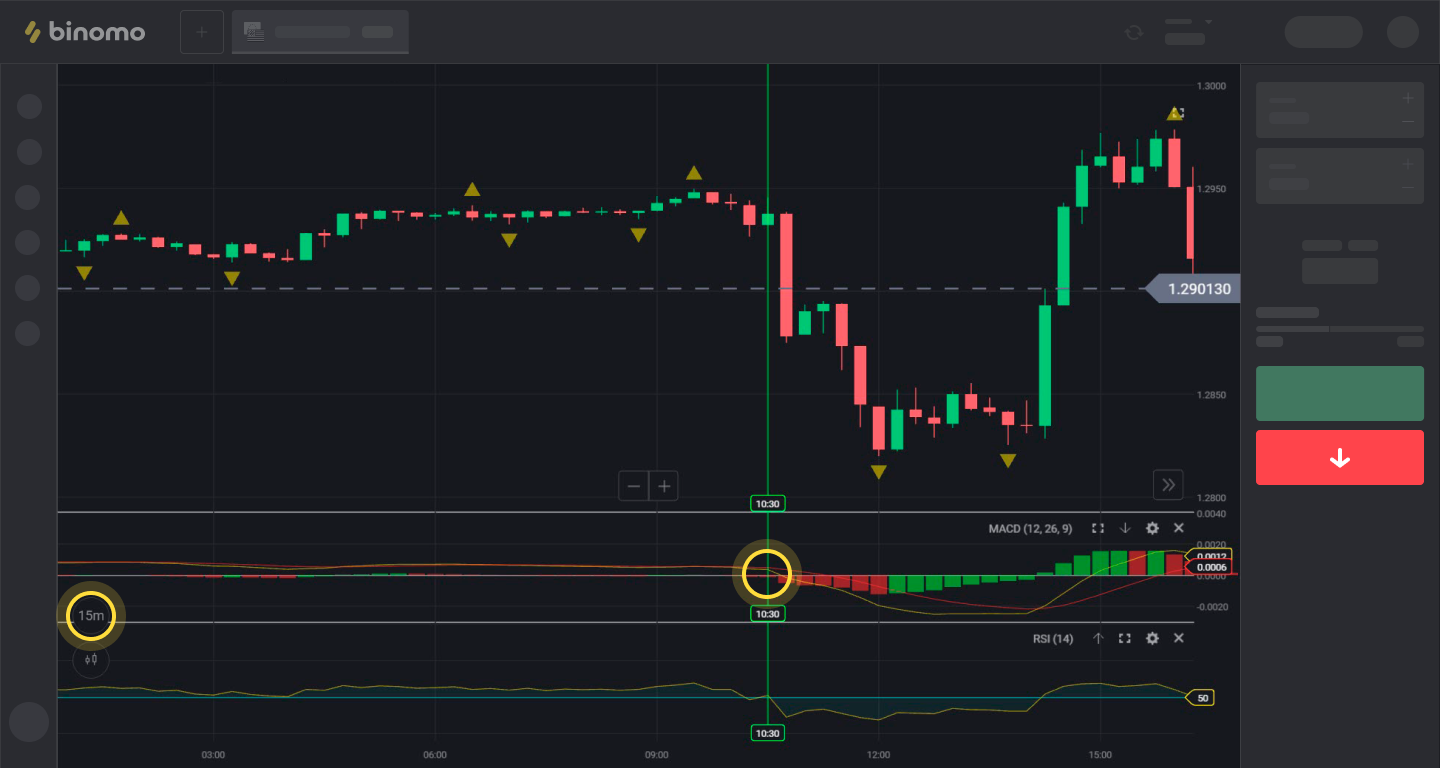
Step 3: Making trades on the Triple Screen strategy
Trades DOWN are made on TF 1M when:
- On the 15M time frame, the MACD histogram bars are below the zero level
- On the 5M time frame, the RSI line has crossed level 50 down.
- On the 1M time frame, we make a trade DOWN, if the asset price has broken (gone below) the last local low down. This low is shown by Fractals:
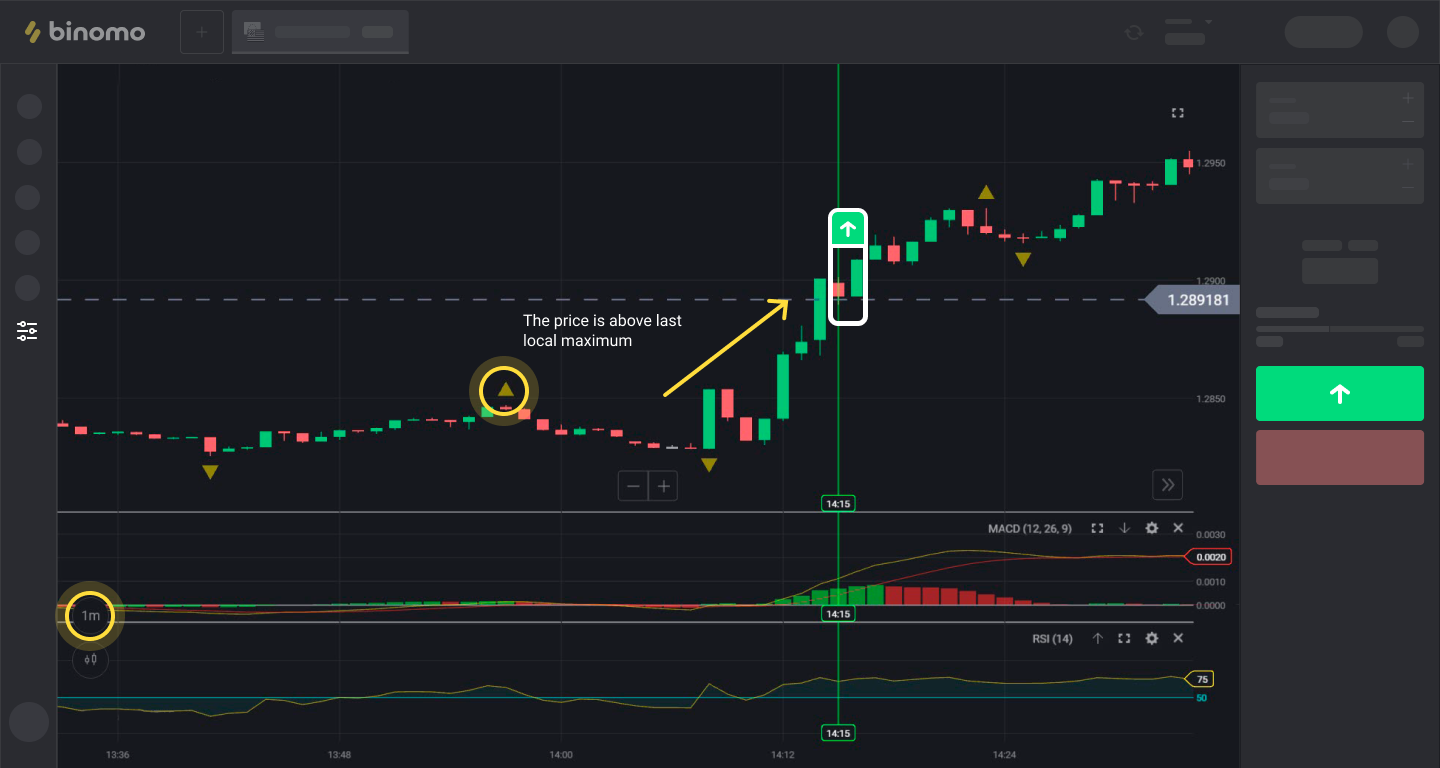
Trades UP are made on TF 1M when:
- On the 15M time frame, the MACD histogram bars are above the zero level
- On the 5M time frame, the RSI line has crossed level 50 up.
- On the 1M time frame, we make a trade UP, if the asset price has broken (gone above) the last local high up. This high is shown by Fractals:
Make trades of 3 to 10 minutes, depending on your asset and market volatility.
The asset should have enough time for its price to cover the distance required to close the trade at a profit.
Use up to 3% of your trading account in trading.
NOTE! Elder's Triple Screen is a trend-following strategy. So it is valid when you trade during the most volatile time of the day, from 7:00 to 15:00 UTC.
.jpeg)


Comments
Post a Comment