On the chart of any asset there are flat periods when the price moves in a narrow “corridor,” i.e. it practically doesn’t change.
After such periods, the quotes will definitely continue to move up or down, and that is a great opportunity to earn.
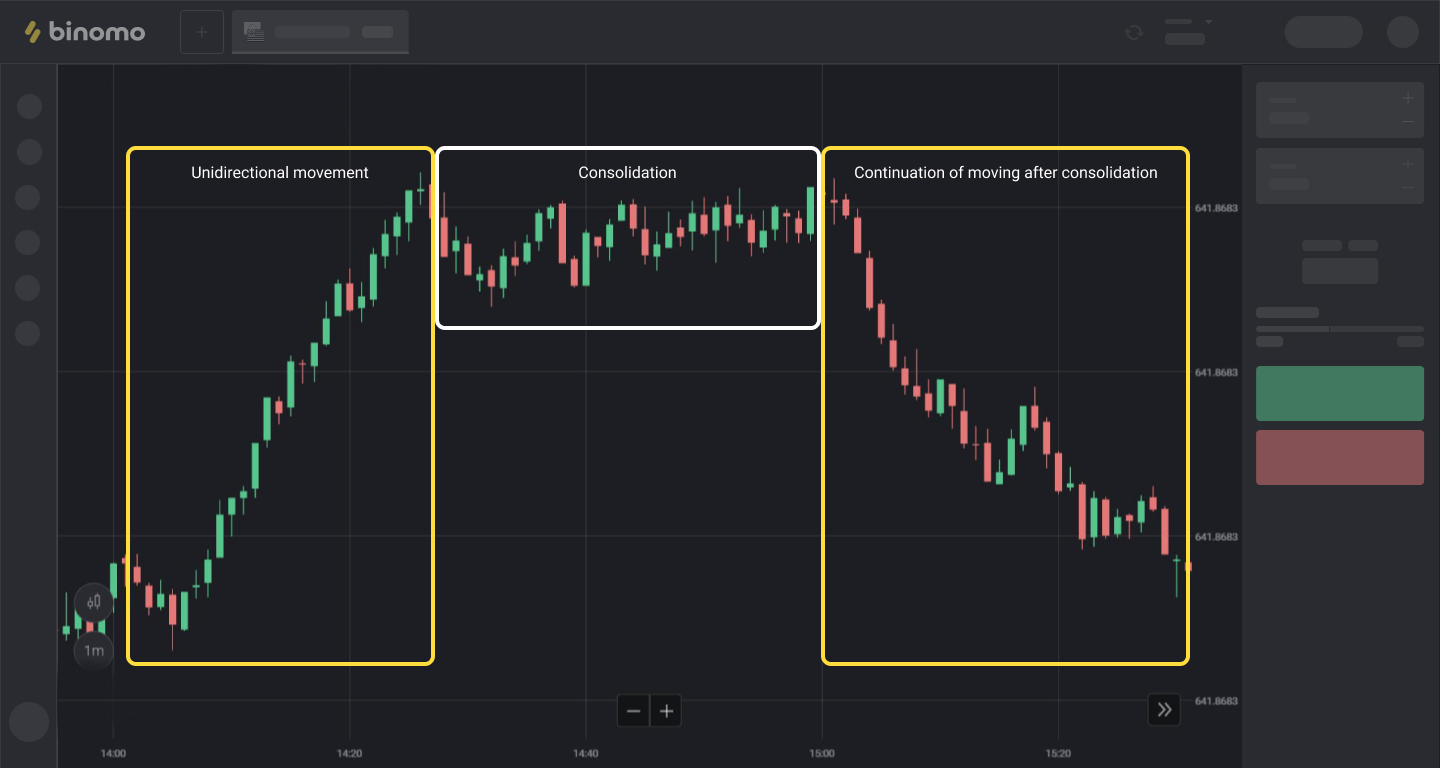
Step 1: Determine a flat:
On the chart, a flat looks like “horizontal” price movement. But after this respite, a reversal always happens when the price begins to actively rise or fall.
Continued movement after the flat
Flat
Active price movementOur task is to find this “horizontal” price movement and, most importantly, to complete a trade right when it ends.
The Bollinger Bands indicator will help us with this best of all.
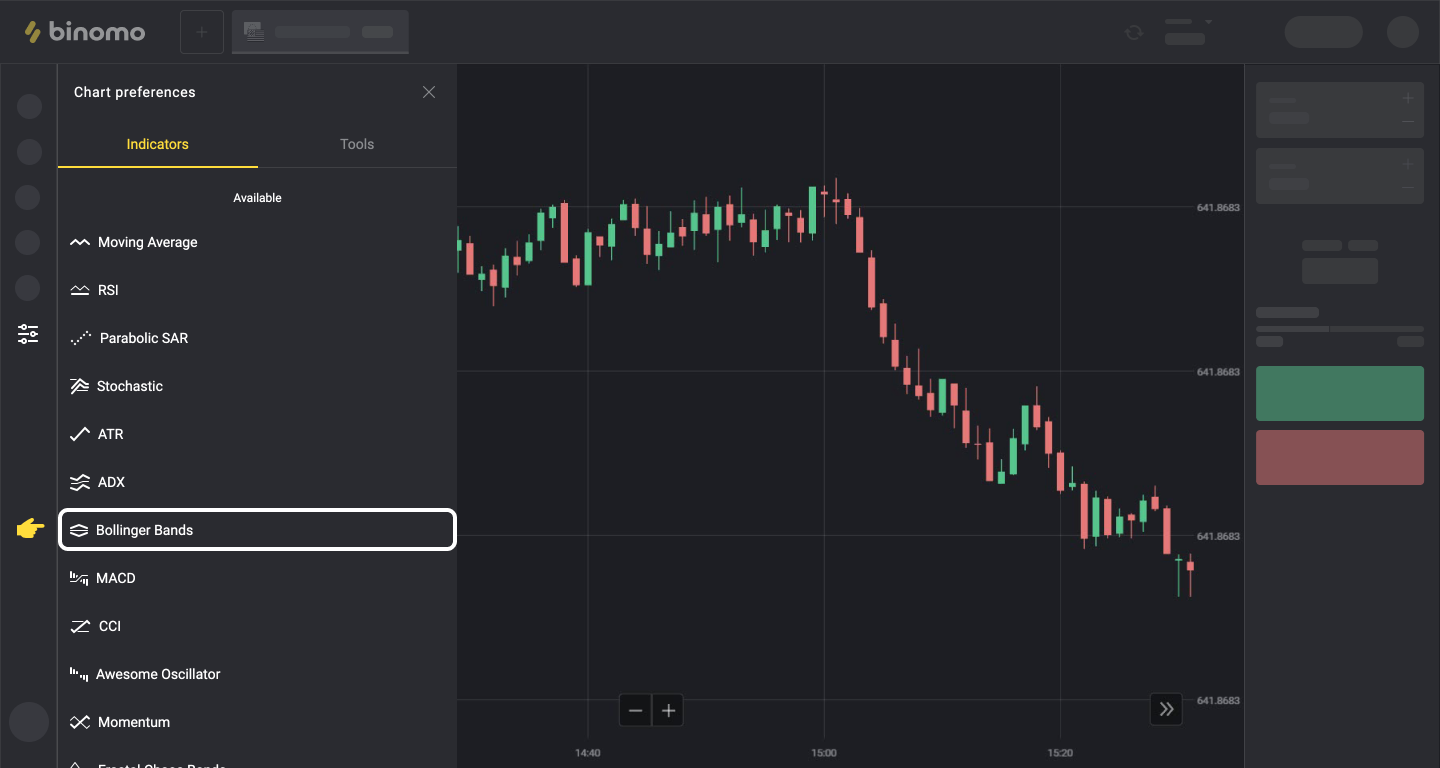
Step 2: Turn on the indicator and see what it shows:
On the Binomo platform, select the Bollinger Bands indicator with the default settings:
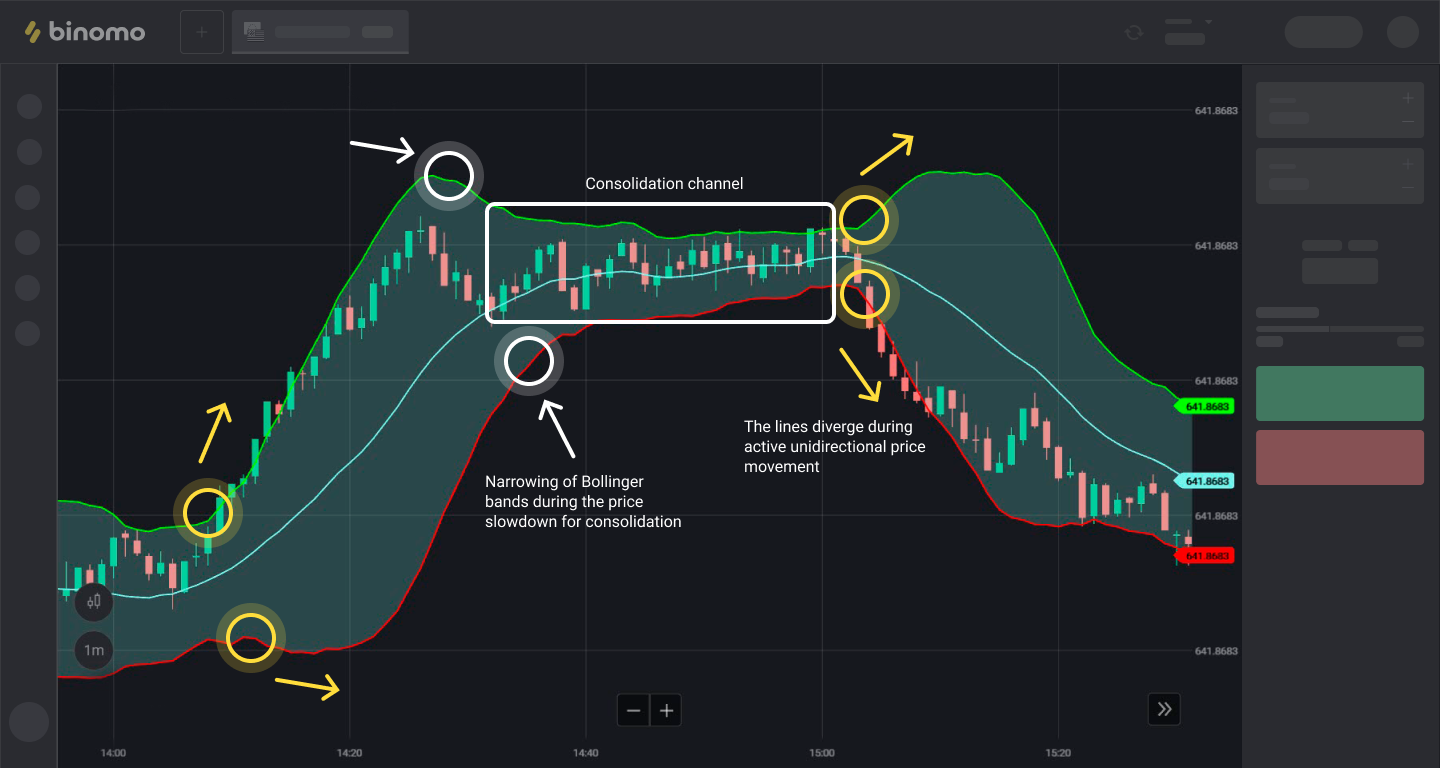
Now look at the chart. You will see that in some places the Bollinger Bands narrow and continue to move very close to each other for some time, but in some, on the contrary, they diverge for a considerable distance.
When the bands diverge from each other, this means that the price is actively rising or falling.
When the lines approach each other, this means that the price change is slowing down and a flat is starting:
The lines diverge during active price movement
Narrowing Bollinger Bands with slowing prices before the flat
FlatStep 3: We use the indicator to profit:
• We wait for the narrowing of the Bollinger Bands and the onset of a flat. We watch the price.
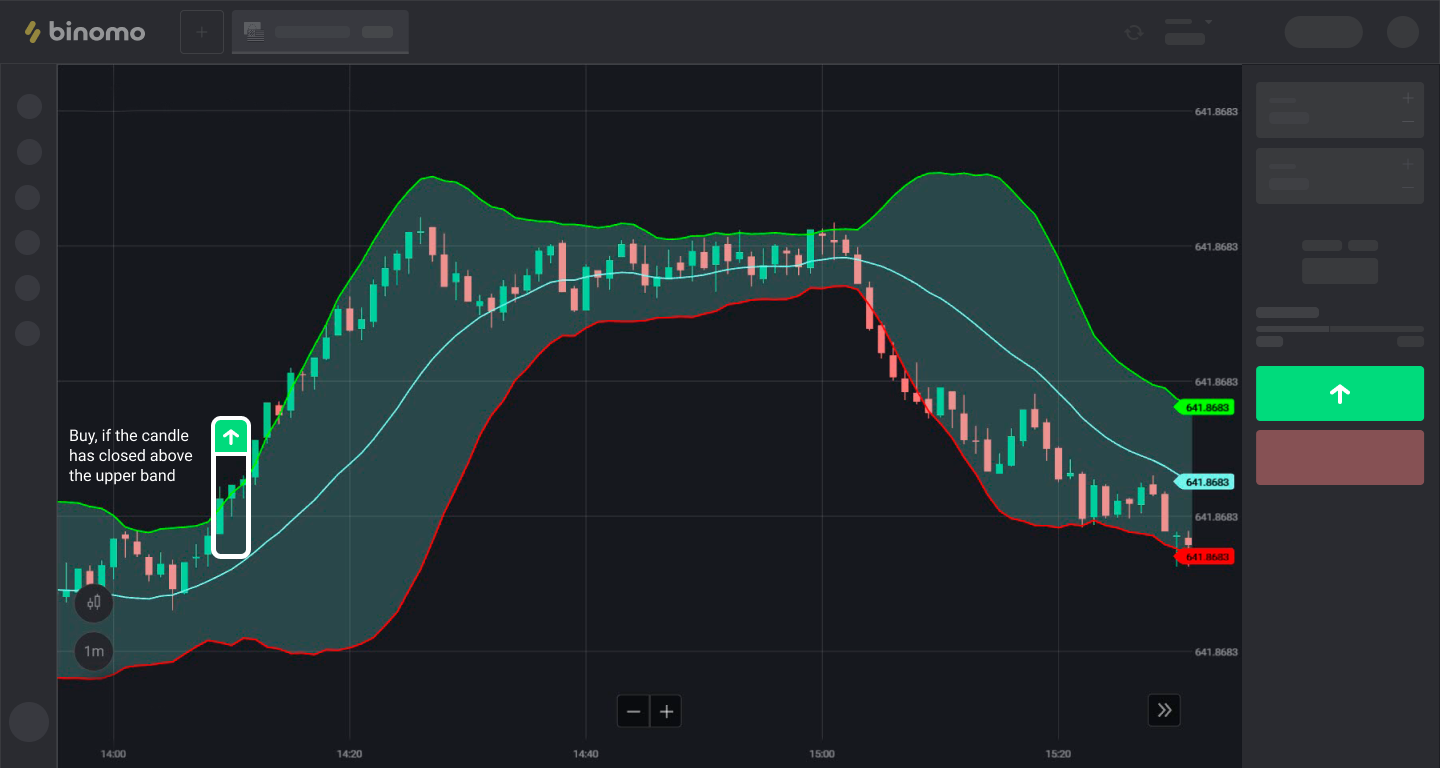
• We wait for the price to go beyond the upper or lower line of the indicator.
• We conclude a trade in the direction of the new price movement, since most often that is where it will move in the near future.
Look at the examples below and it will immediately become clear!
Trade UP when the price candlestick CLOSES ABOVE the upper line of the indicator:
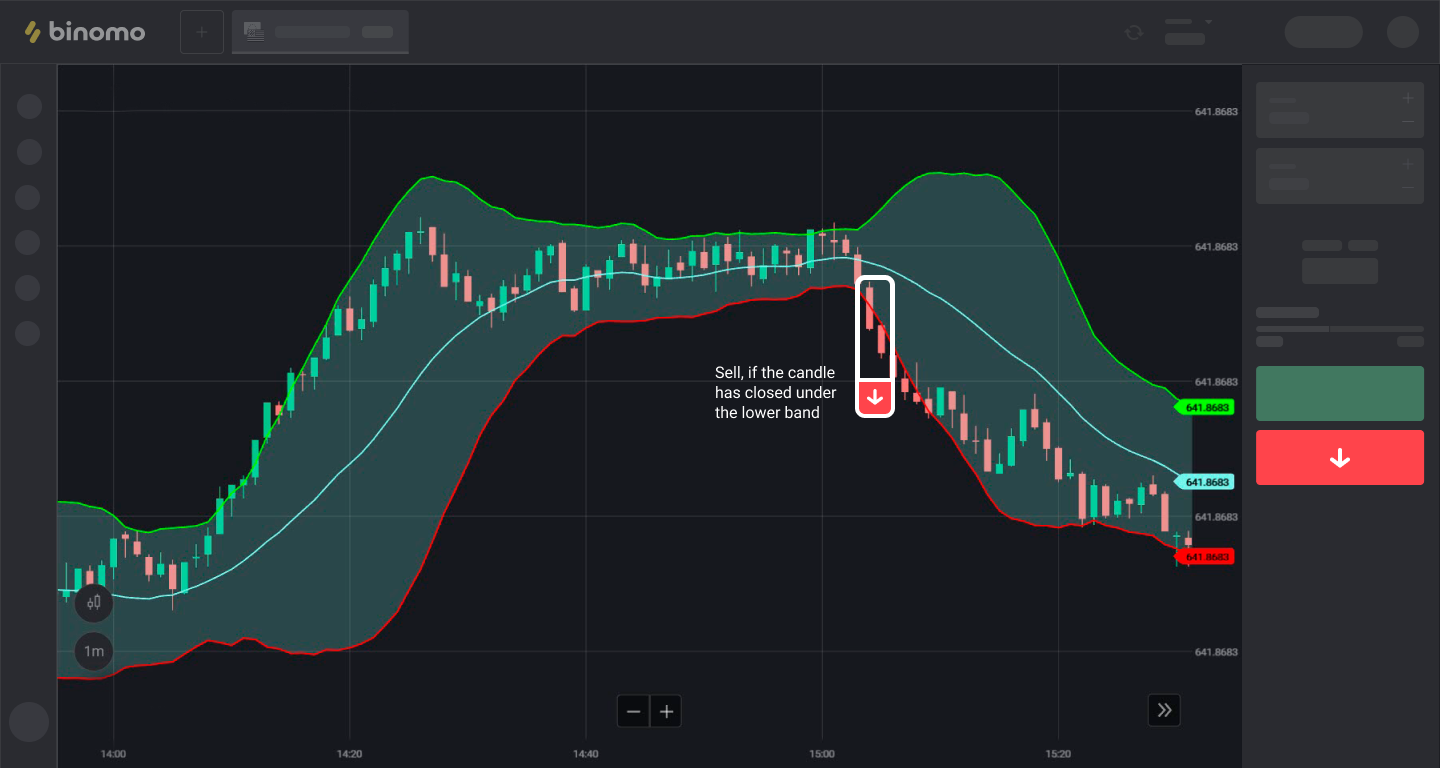
Up trade if the candle closes above the upper lineTrade DOWN when the price candlestick CLOSES BELOW the lower line of the indicator:
Down trade if the candle closes below the lower lineIMPORTANT!
- The expiration time (time until the trade closes) depends on what time frame you are trading on and the intensity of price movement after the flat.
If you chose the 5S-15S time frame, an expiration period of 1-5 minutes is best.
If you prefer longer time frames, INCREASE the expiration period.
- Remember that it is highly recommended not to use more than 3% of your capital on one trade. And if you are a beginner, use no more than 1-2%.
.jpeg)


Comments
Post a Comment